
- Title
-
RNA polymerase II clusters form in line with surface condensation on regulatory chromatin
- Authors
- Pancholi, A., Klingberg, T., Zhang, W., Prizak, R., Mamontova, I., Noa, A., Sobucki, M., Kobitski, A.Y., Nienhaus, G.U., Zaburdaev, V., Hilbert, L.
- Source
- Full text @ Mol. Syst. Biol.
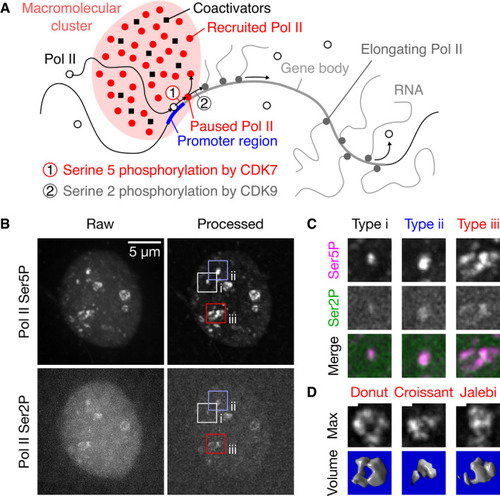
Sketch of the recruitment and pause release of RNA polymerase II (Pol II) in the context of macromolecular clusters. Representative maximum‐intensity projection of a nucleus in a live zebrafish embryo (sphere stage), where Pol II was detected via fluorescently labeled antigen‐binding fragments (Fab) specific against Ser5 and Ser2 phosphorylation of the C‐terminal domain heptad repeat (Pol II Ser5P, Pol II Ser2P). Pol II Ser5P clusters representing the different apparent types of morphologies are marked. Single time point z‐stacks were recorded using an instantaneous Structured Illumination Microscope (instant‐SIM), raw data were processed by local background subtraction (both channels) and smoothed (Pol II Ser2P only). Detail views of the clusters of the apparent morphology types i–iii, as marked in panel (B). The detail views are 2.7 μm across. Examples of the varied morphologies of type iii clusters, shown as maximum‐intensity projections and corresponding volume renderings of the processed Pol II Ser5P signal. Morphologies are named by similarity to patisserie and candy items. Scale bar: 500 nm. 3D renderings: ImageJ Volume Viewer plugin. |

Representative nuclear mid‐section obtained by STEDD super‐resolution microscopy from a fixed sphere‐stage zebrafish embryo. Pol II Ser5P intensity distributions were obtained by STEDD microscopy, Pol II Ser2P intensity distributions by regular confocal microscopy from the same focal plane. Pol II Ser5P clusters with typical morphologies i–iii are marked. Detail views of the marked clusters, representing the typical morphologies i–iii. Area and solidity of individual clusters, with gate regions for the typical morphologies i–iii. Clusters were segmented based on Pol II Ser5P intensity, data obtained from a total of 52 mid‐nuclear sections from two different samples. The Pol II Ser5P and Pol II Ser2P intensities (mean intensity across all pixels inside a given cluster's segmentation mask) of the clusters in the gates i–iii are plotted in color over the entire ungated cluster population (light gray). Mean Pol II Ser5P and Pol II Ser2P intensities were scaled by the median value for each nucleus, then pooled. The median of the Pol II Ser5P and Pol II Ser2P levels of the gated clusters in panel D is plotted over the ungated population of clusters. Each cluster type is plotted with 95% bootstrapped confidence intervals in Pol II Ser5P and Pol II Ser2P direction (10,000 resamples). Analysis of the placement of Pol II Ser2P spots relative to Pol II Ser5P clusters of type ii or type iii (spots segmented based on Pol II Ser2P channel). Lines represent histograms of the distances to the nearest surface of a Pol II Ser5P cluster. The Euclidean metric was used to calculate distance of Ser2P foci gated pixels from nearest cluster. To display relative enrichment against random placement, histogram bin counts are normalized by counts for ungated pixel distances, then scaled by the mean across bins. Sketch of apparent morphology types of Pol II Ser5P clusters, placed by their levels of elongating and recruited Pol II. |
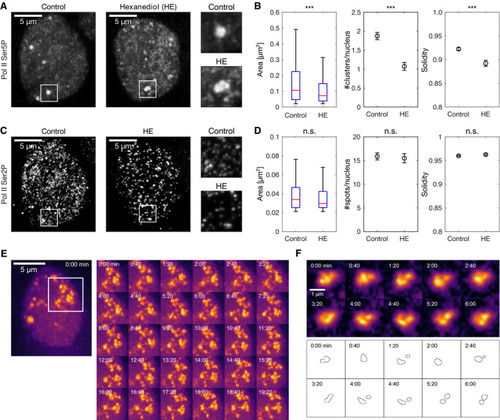
Representative maximum‐intensity projection micrographs of nuclei in primary cell cultures of zebrafish embryos, treated for 5 min with control media or 3% 1,6‐hexanediol (HE), then fixed and labeled for Pol II Ser5P and Ser2P by immunofluorescence, images recorded by instant‐SIM, this panel shows only the Pol II Ser5P channel. Quantification of changes in Pol II Ser5P cluster morphology upon hexanediol treatment. Area displayed as standard boxplots, solidity and the number of clusters per nucleus are mean±SEM. *** indicates Pol II Ser2P channel micrographs of the same nuclei shown in panel A. Quantification of changes in Pol II Ser2P spots. Representative time‐lapse recording of Pol II Ser5P Fab in a live embryo (no hexanediol treatment). Similar results were observed in two independent experiments, each performed on three different embryos. Images are maximum‐intensity projections, and images recorded by instant‐SIM. Representative close‐up time‐lapse showing transient merging and separation events within a Pol II Ser5P cluster. Single z‐sections, images were bleaching‐corrected and local background was subtracted (radius 3.3 μm). Images from same data set as panel (E). Contour plots are obtained by application of a manually adjusted threshold to assist interpretation, same threshold for all time points. |
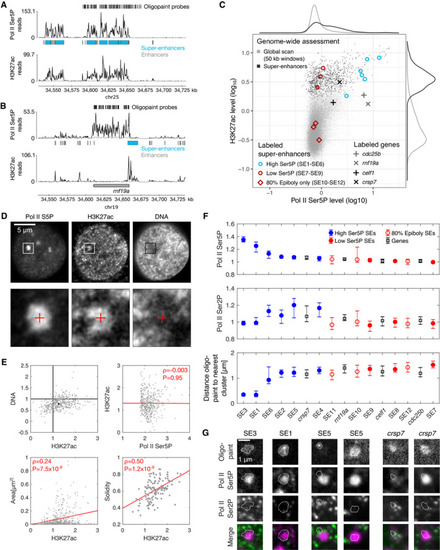
Example view of a genomic region containing a super‐enhancer (SE3), for an overview of all genomic regions labeled by oligopaint probe sets see Appendix Fig Example view of a genomic region containing a gene with high Pol II Ser5P levels at the promoter ( Overview of Pol II Ser5P and H3K27ac ChIP‐seq levels for 50‐kb windows covering the entire genome, windows covering regions containing super‐enhancers, and symbols indicating regions covered by specific oligopaint probe sets. Top row—representative optical section obtained by three‐color STED microscopy from a fixed zebrafish embryo, showing Pol II Ser5P and H3K27ac (immunofluorescence) and DNA (JF646‐Hoechst). Bottom row—Detail views as marked in the top row. The details views are 2.4 μm across. Mean fluorescence intensities (normalized against median intensity of a given nucleus) within Pol II Ser5P clusters. Overall levels of H3K27ac and DNA inside clusters were determined (values for individual clusters in gray, median with 95% bootstrap confidence interval in black) as well as correlations between H3K27ac intensity and Pol II Ser5P intensity, cluster area, and cluster solidity (Pearson correlation coefficient, red line is a linear fit to guide the eye). Assessment of Pol II Ser5P and Pol II Ser2P immunofluorescence signal intensities at the location of super‐enhancer probe sets. Genomic target regions are sorted left‐to‐right by descending Pol II Ser5P signal. Intensities are normalized by the whole nucleus median level, shown is the median with 95% bootstrap confidence intervals. Representative images of indicated oligopaint probe sets and immunofluorescence signal, two examples are shown for SE5 and |

Sketch of cluster nucleation with the different species involved in the model. Examples of lattice configurations obtained from simulations containing only red particles with increasing self‐affinity ( Interaction matrix for different species in the lattice model. Affinity is represented by negative and repulsion by positive values. Long time behavior (total of 1 × 10⁷ iteration steps) of the model shown as lattice output and synthetic microscopy images, 30‐by‐30 lattice, Time‐lapse showing transient separation and merging events of a S5P cluster. 25‐by‐25 lattice, Simulated hexanediol treatment. 25‐by‐25 lattices, Correlations between H3K27ac intensity (RC) and cluster area (in units of lattice cells, |

Example lattice configurations for all three cluster morphology cluster types (i–iii) are shown as lattice simulation output and the corresponding synthetic microscopy images. Area and solidity of individual clusters, with gate regions for the typical morphologies i–iii. Clusters were segmented based on Pol II Ser5P intensity (total 11,248 clusters). For each simulation, four chains with regions of randomly assigned length of The Pol II Ser5P and Pol II Ser2P intensities (mean intensity across all pixels inside a given cluster's segmentation mask) of the clusters in gates i–iii (color), ungated cluster population in gray. Intensities were scaled by the population median. Pol II Ser5P and Pol II Ser2P levels of the gated clusters in panel (C) plotted over the ungated population of clusters, median with 95% bootstrap confidence interval. For all types (i–iii), the confidence interval is hidden by the median data point. |
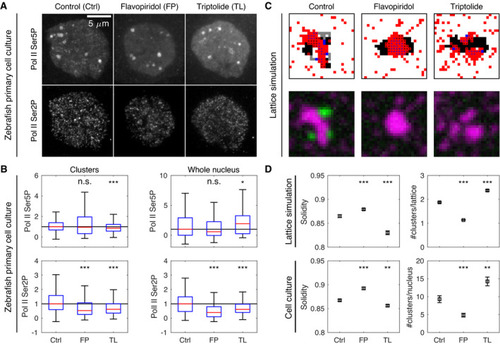
Representative micrographs showing Pol II Ser5P and Pol II Ser2P in primary cell cultures obtained from zebrafish embryos and treated for 30 min with control media (Ctrl), flavopiridol (FP, 1 μM), or triptolide (TL, 500 nM). Cell cultures were fixed at the end of treatment, labeled by immunofluorescence, and microscopy images were acquired by instant‐SIM. Shown are maximum‐intensity intensity projections, same color scaling used across conditions. Pol II Ser5P and Pol II Ser2P intensities at Pol II Ser5P clusters and throughout entire nuclei, standard boxplots. *** indicates Examples of lattice configurations obtained from simulations with modifications that mimic inhibitor treatments. For flavopiridol treatment, no gray regions were assigned. For triptolide, no gray regions were assigned, the Pol Ser5P self‐affinity ( Cluster solidity and the number of clusters obtained from lattice simulations and microscopy images of cell cultures, mean±SEM. Quantification was based on synthetic microscopy images, |