Figure Caption
Figure 7
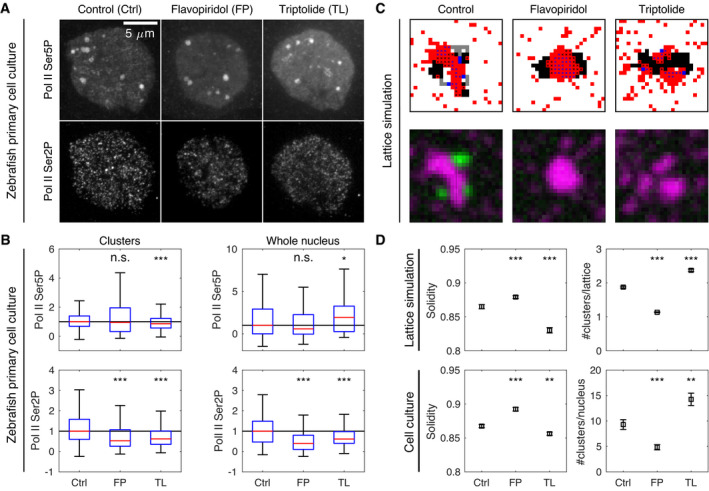
Lattice simulations reproduce the effect of transcription inhibitors on cluster morphologyRepresentative micrographs showing Pol II Ser5P and Pol II Ser2P in primary cell cultures obtained from zebrafish embryos and treated for 30 min with control media (Ctrl), flavopiridol (FP, 1 μM), or triptolide (TL, 500 nM). Cell cultures were fixed at the end of treatment, labeled by immunofluorescence, and microscopy images were acquired by instant‐SIM. Shown are maximum‐intensity intensity projections, same color scaling used across conditions.
Pol II Ser5P and Pol II Ser2P intensities at Pol II Ser5P clusters and throughout entire nuclei, standard boxplots. *** indicates P < 0.0003, * indicates P < 0.017, n.s. indicates P ≥ 0.017, significance levels Bonferroni‐corrected for multiple testing (two‐tailed permutation test for differences from control, data obtained from three independent sets of experiments; Pol II Ser5P at clusters: P = 0.08, P < 0.0001, n = 1,534, 716, 1,682 clusters; Pol II Ser2P at clusters: P < 0.0001, P < 0.0001, n = 1,534, 716, 1,682 clusters; Pol II Ser5P throughout nuclei: P = 0.17, P = 0.014 with n = 165, 148, 118 nuclei; Pol II Ser2P throughout nuclei: P < 0.0001, P = 0.0001 with n = 165, 148, 118 nuclei; data obtained from three independent experiments). For additional properties and actinomycin D treatment, see Appendix Fig S14A.
Examples of lattice configurations obtained from simulations with modifications that mimic inhibitor treatments. For flavopiridol treatment, no gray regions were assigned. For triptolide, no gray regions were assigned, the Pol Ser5P self‐affinity (wS5P‐S5P = −0.25) and affinity to regulatory regions (wRC‐RC = −0.25) were reduced, and the number of red particles was increased from 100 to 120.
Cluster solidity and the number of clusters obtained from lattice simulations and microscopy images of cell cultures, mean±SEM. Quantification was based on synthetic microscopy images, n = 1,000 images analyzed per condition. For lattice simulations, *** indicates P < 0.0005; for cell cultures, *** indicates P < 0.0003, ** indicates P < 0.003 (simulations, solidity: P < 0.0001, P < 0.0001 with n = 1,000, 1,000, 1,000; simulations, number of clusters: P < 0.0001, P < 0.0001 n = 1,000, 1,000, 1,000; cell culture, solidity: P < 0.0001, P = 0.0007 with n = 1,514, 703, 1,631 clusters; cell culture, number of clusters: P < 0.0001, P = 0.001 with n = 165, 148, 118 nuclei).
Acknowledgments
This image is the copyrighted work of the attributed author or publisher, and
ZFIN has permission only to display this image to its users.
Additional permissions should be obtained from the applicable author or publisher of the image.
Full text @ Mol. Syst. Biol.