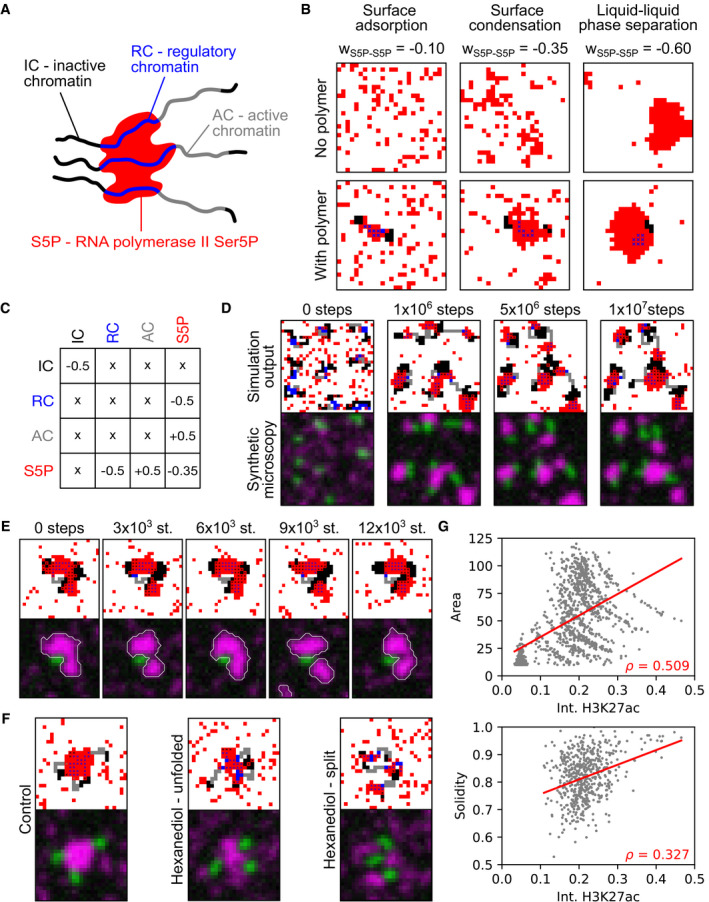
IMAGE

Figure 5

ID
ZDB-IMAGE-211009-24
Source
Figures for Pancholi et al., 2021
Image
Figure Caption

Figure 5 A lattice model exhibits key characteristics of liquid‐phase condensation with a polymeric subregion as a surface

Sketch of cluster nucleation with the different species involved in the model.

Examples of lattice configurations obtained from simulations containing only red particles with increasing self‐affinity (wS5P‐S5P, as indicated). Lattice simulations containing a polymer chain of length Lpolymer = 20 with NIC = 12 black monomers (black‐black affinity wIC‐IC = −0.5) and NRC = 8 blue monomers (blue‐red affinity wRC‐S5P = −0.5, adjustment see Appendix Fig S10), same wS5P‐S5P values as for simulations without polymer chain. All simulations on 25‐by‐25 lattices, NS5P = 100 red particles, for adjustment of NS5P, see Appendix Fig S10A.

Interaction matrix for different species in the lattice model. Affinity is represented by negative and repulsion by positive values.

Long time behavior (total of 1 × 107 iteration steps) of the model shown as lattice output and synthetic microscopy images, 30‐by‐30 lattice, NS5P = 140, nine chains, extent of blue and gray regions chosen randomly for each chain at initialization.

Time‐lapse showing transient separation and merging events of a S5P cluster. 25‐by‐25 lattice, NS5P = 100, four chains.

Simulated hexanediol treatment. 25‐by‐25 lattices, NS5P = 100, three chains, NRC = 8, NAC = 6, modified parameter values in hexanediol simulations: wS5P‐S5P = −0.15, wS5P‐RC = −0.25.

Correlations between H3K27ac intensity (RC) and cluster area (in units of lattice cells, n = 1,132) and cluster solidity (only including clusters with area greater 50, n = 551, ρ is the Pearson correlation coefficient, red line—linear fit to guide the eye). Analysis based on 30 simulations of 25‐by‐25 lattices, NS5P = 100, four chains per lattice, extent of blue and gray regions randomly assigned per chain at initialization of each simulation.

Acknowledgments
This image is the copyrighted work of the attributed author or publisher, and ZFIN has permission only to display this image to its users. Additional permissions should be obtained from the applicable author or publisher of the image. Full text @ Mol. Syst. Biol.