
Figure 3
- ID
- ZDB-FIG-211009-18
- Publication
- Pancholi et al., 2021 - RNA polymerase II clusters form in line with surface condensation on regulatory chromatin
- Other Figures
- All Figure Page
- Back to All Figure Page
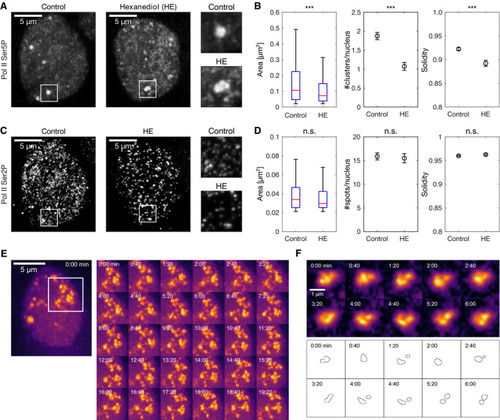
Representative maximum‐intensity projection micrographs of nuclei in primary cell cultures of zebrafish embryos, treated for 5 min with control media or 3% 1,6‐hexanediol (HE), then fixed and labeled for Pol II Ser5P and Ser2P by immunofluorescence, images recorded by instant‐SIM, this panel shows only the Pol II Ser5P channel. Quantification of changes in Pol II Ser5P cluster morphology upon hexanediol treatment. Area displayed as standard boxplots, solidity and the number of clusters per nucleus are mean±SEM. *** indicates Pol II Ser2P channel micrographs of the same nuclei shown in panel A. Quantification of changes in Pol II Ser2P spots. Representative time‐lapse recording of Pol II Ser5P Fab in a live embryo (no hexanediol treatment). Similar results were observed in two independent experiments, each performed on three different embryos. Images are maximum‐intensity projections, and images recorded by instant‐SIM. Representative close‐up time‐lapse showing transient merging and separation events within a Pol II Ser5P cluster. Single z‐sections, images were bleaching‐corrected and local background was subtracted (radius 3.3 μm). Images from same data set as panel (E). Contour plots are obtained by application of a manually adjusted threshold to assist interpretation, same threshold for all time points. |