
|
Figure 1
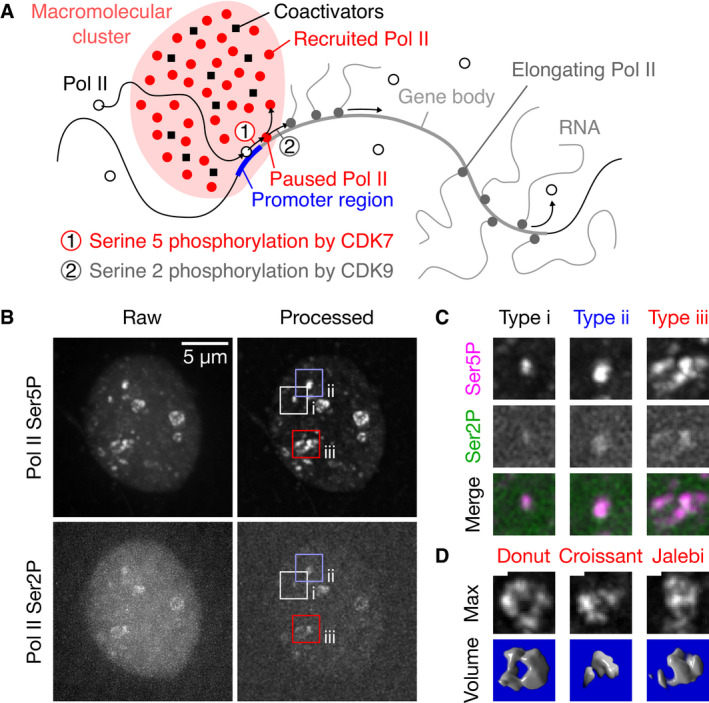
Sketch of the recruitment and pause release of RNA polymerase II (Pol II) in the context of macromolecular clusters. Representative maximum‐intensity projection of a nucleus in a live zebrafish embryo (sphere stage), where Pol II was detected via fluorescently labeled antigen‐binding fragments (Fab) specific against Ser5 and Ser2 phosphorylation of the C‐terminal domain heptad repeat (Pol II Ser5P, Pol II Ser2P). Pol II Ser5P clusters representing the different apparent types of morphologies are marked. Single time point z‐stacks were recorded using an instantaneous Structured Illumination Microscope (instant‐SIM), raw data were processed by local background subtraction (both channels) and smoothed (Pol II Ser2P only). Detail views of the clusters of the apparent morphology types i–iii, as marked in panel (B). The detail views are 2.7 μm across. Examples of the varied morphologies of type iii clusters, shown as maximum‐intensity projections and corresponding volume renderings of the processed Pol II Ser5P signal. Morphologies are named by similarity to patisserie and candy items. Scale bar: 500 nm. 3D renderings: ImageJ Volume Viewer plugin.