
- Title
-
Loss-of-Function of p21-Activated Kinase 2 Links BMP Signaling to Neural Tube Patterning Defects
- Authors
- Wang, Y., Zhang, K., Guo, J., Yang, S., Shi, X., Pan, J., Sun, Z., Zou, J., Li, Y., Li, Y., Fan, T., Song, W., Cheng, F., Zeng, C., Li, J., Zhang, T., Sun, Z.S.
- Source
- Full text @ Adv Sci (Weinh)
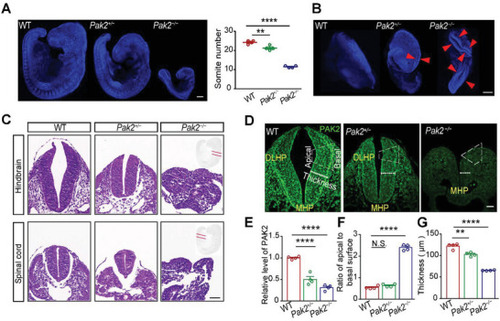
Pak2−/− embryos fail to develop DLHPs. A) Numbers of somite in WT, Pak2 +/−, and Pak2 −/− embryos at E9.5. (F (2, 9) = 188.2, p < 0.0001; p < 0.0001 for WT versus Pak2 −/− mice, p = 0.0034 for WT versus Pak2 +/− mice). B) Pak2 −/− embryos exhibit a characteristic phenotype of craniorachischisis, with an open neural tube (indicated by asterisks) extending from the forebrain to the posterior spinal cord. C) Hematoxylin/eosin‐stained hindbrain and spinal cord of WT and Pak2 −/− embryos at E9.5. D) Quantification of the neural tube of WT, Pak2 +/−, and Pak2 −/− embryos at E9.5. E–G)The PAK2 levels (E, F (2, 9) = 72.68, p < 0.0001; p < 0.0001 for WT versus Pak2 −/− mice, p < 0.0001 for WT versus Pak2 +/− mice), the ratio of apical to basal surface at the DLHP (F, WT, 0.547 ± 0.034; Pak2 −/− mice, 2.397 ± 0.067; Pak2 +/− mice, 0.640 ± 0.037; F (2, 9) = 460.7, p < 0.0001; p = 0.0001 for WT versus Pak2 −/− mice, p = 0.335 for WT versus Pak2 +/− mice), and the thickness of neural tube (G, p = 0.0001 for WT versus Pak2 −/− mice, p = 0.003 for WT versus Pak2 +/− mice) of WT, Pak2 +/−, and Pak2 −/− embryos at E9.5. One‐way ANOVA with Dunnett's multiple comparisons, n = 4 embryos for each genotype (A, E, F, G). Scale bar: 200 µm (A,B); 20 µm (C,D). |

Pak2 −/− mouse embryos exhibit upregulated BMP signaling. A,B) GO analysis indicates that DEGs are enriched in head development and pattern specification processes. Blue bars indicate NTD‐related genes. Scale bar: transcripts per million (TPM) after log2 transforms and Z‐score normalization. C) DEGs that are closely related to BMP signaling in Pak2 −/− embryos. D) The levels of key components of BMP signaling, including Bmp4 and Bmp5, in WT and Pak2 −/− embryos at E9.5. Bmp4: t (6) = 6.112, p = 0.0009; Bmp5: t (6) = 3.06, p = 0.0222. n = 4 embryos for each genotype. E) The level of PAK2 and p‐Smad1/5/9 (Ser465) in Pak2 −/− embryos as shown via western blotting (for PAK2, WT, 1.347 ± 0.151; Pak2 −/− mice, 0.059 ± 0.009; t (6) = 8.542, p = 0.0001; for p‐Smad1/5/9, WT, 1 ± 0.057; Pak2 −/− mice, 2.272 ± 0.109; t (6) = 10.35, p < 0.0001) of the hindbrain of embryos at E9.5. n = 4 embryos for each genotype. F) The level of p‐Smad1/5/9 (Ser465) in Pak2 −/− mice as shown via immunofluorescence analysis of the hindbrain of embryos at E9.5. WT, 1 ± 0.106; Pak2 −/− mice, 1.632 ± 0.170; t (4) = 3.161, p = 0.034. n = 3 embryos for each genotype. G) The numbers of Pax6‐positive cell (WT, 214.3 ± 6.921; Pak2 −/− mice, 4.5 ± 2.021; t (6) = 29.09, p < 0.0001) and cells stained with cleaved caspase‐3 (WT, 3.250 ± 0.750; Pak2 −/− mice, 88.25 ± 7.028; t (6) = 12.03, p < 0.0001) in the hindbrain of WT and Pak2 −/− embryos at E9.5. n = 4 embryos for each genotype. Unpaired t test. Scale bar: 20 µm. |
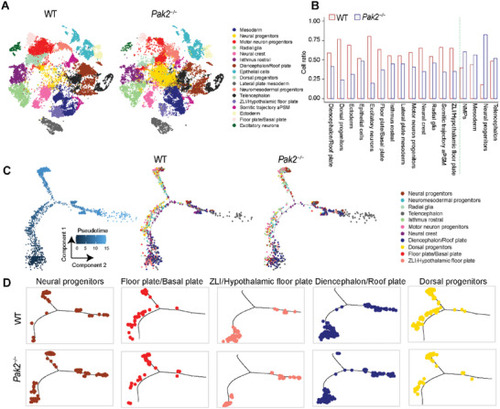
Abnormal developmental process in Pak2−/− embryos. A) The annotation and color codes for cell clusters in WT and Pak2−/− embryos at E9.5 as revealed by scRNA‐seq analysis. B) Cell ratio in different cell cluster between WT and Pak2 −/− embryos. C) Pseudotime‐ordered analysis of 11 cell types related to neural tube in WT and Pak2−/− embryos. The blue trajectory includes cell types in both WT and Pak2−/− samples. D) Representative developmental trajectory of cell types from WT and Pak2−/− samples via pseudotime‐ordered analysis. |

Abnormal transcriptional changes along with abnormal developmental process in Pak2 −/− embryos. A) Heatmap showed the dynamic changes in gene expression along the pseudotime (lower panel). Cell types are labeled by colors (upper panel). B) 2D plots show the expression scores related to neural tube development, BMP signaling, forebrain development, and diencephalon development along the pseudotime. C) 2D plots show the dynamic expression of representative genes during neural tube development along the pseudotime. |

Identification of PAK2 mutations in human fetuses with NTDs. A) Two nonsynonymous (c.451C>T, p.P151S; c.758A>C, p.E253A) and one recurrent splice site mutation (c.289‐3T>A) in the PAK2 gene are identified among five patients with NTDs and validated using Sanger sequencing. B) Sequence conservation analysis of the amino acid sequences at P151 and E253 of PAK2 among multiple vertebrates. C1–C2) The relative levels of PAK2 and key components in BMP signaling in brain tissues of health controls and human NTDs carrying PAK2 mutations as shown using the NanoString nCounter RNA assay. C1, Color bar represents log2 fold‐change; C2, the relative levels of each gene are presented as the mean ± SEM. D) The levels of PAK2 (F = 7.612, p = 0.0052; p < 0.01 for WT‐PAK2 versus PAK2‐P151S) in N2a cells transfected with WT‐PAK2 and PAK2‐P151S. E) The levels of PAK2 (F (2, 15) = 26.41, p < 0.0001; p = 0.0002 for WT‐PAK2 versus PAK2‐E253A) in N2a cells transfected with WT‐PAK2 and PAK2‐E253A. F) The levels of PAK2 in N2a cells transfected with PAK2‐P151S (p = 0.298 for MG132; p = 0.016 for BAF A1) or PAK2‐E253A (p = 0.019 for MG132, p = 0.049 for BAF A1) were treated with MG132 or Baf‐A1 for 6 h. G) The levels of ADP in N2a cells transfected with WT‐PAK2, PAK2‐P151S and PAK2‐E253A. p = 0.007 for WT‐PAK2 versus PAK2‐P151S, p < 0.0001 for WT‐PAK2 versus PAK2‐E253A. H) The levels of pPAK2 (Ser141) in N2a cells transfected with WT‐PAK2, PAK2‐P151S and PAK2‐E253A. p = 0.026 for WT‐PAK2 versus PAK2‐P151S, p = 0.036 for WT‐PAK2 versus PAK2‐E253A. One‐way ANOVA with Dunnett's multiple comparison test (D–H). n = 6 cultures for each group. |

PAK2 regulates Smad9 phosphorylation to inhibit BMP signaling. A) The levels of p‐Smad1/5/9 (Ser 465) (F (2, 15) = 5.185, p = 0.019; for WT‐PAK2 versus PAK2‐P151S, p = 0.0185) in N2a cells transfected with WT‐PAK2 and PAK2‐P151S. n = 6 cultures for each group. B) The levels of p‐Smad1/5/9 (Ser 465) (F (2, 15) = 5.33, p = 0.018; for WT‐PAK2 versus PAK2‐E253A, p = 0.029) in N2a cells transfected with WT‐PAK2 and PAK2‐E253A. n = 6 cultures for each group. C) The levels of p‐Smad1/5/9 (Ser465) in N2a cells overexpressing WT‐PAK2, WT‐PAK2/WT‐SMAD9, and WT‐PAK2/SMAD9‐S417E plasmids. F (3, 28) = 7.393, p = 0.0009; for WT‐PAK2/WT‐SMAD9 versus WT‐PAK2/SMAD9‐S417E, p = 0.0004, n = 8 cultures for each group. D) The levels of p‐Smad1/5/9 (Ser465) in HEK293T cells overexpressing WT‐PAK2, WT‐PAK2/WT‐SMAD9, and WT‐PAK2/SMAD9‐S417E plasmids. F (3, 20) = 4.833, p = 0.011, WT‐PAK2/WT‐SMAD9 versus WT‐PAK2/SMAD9‐S417E, p = 0.025. n = 6 cultures for each group. E) Coimmunoprecipitation of Smad9 with PAK2, whereas SMAD9‐S417E, PAK2‐P151S, and PAK2‐E253A fail to interact with PAK2 and Smad9, respectively. One‐way ANOVA with Dunnett's multiple comparison test (A,B) and with Tukey's multiple comparison test (C,D). |

Depletion of pak2a in zebrafish induces neural tube defects, which were partially rescued by overexpression of WT‐PAK2, but not PAK2 mutations. A) The pak2a mutant pak2a Δ14, which contains a 14 bp deletion in the second exon, is generated using the CRISPR‐Cas9 system. B,C) An overt cavity in the third ventricle and diencephalon and a hemorrhage phenotype are observed in pak2a Δ14 mutants at 48 hpf. n = 20 for sibling, n = 31 for pak2a Δ14 mutants. D) The proportion of embryos with neural tube defects injected with mRNAs harboring human WT‐PAK2, PAK2‐P151S, PAK2‐E253A, and PAK2‐K278R mutants. n = 245 embryos for pak2a Δ14 without injection, n = 236 embryos for pak2a Δ14 with WT‐PAK2 injection, n = 95 embryos for pak2a Δ14 with PAK2‐P151S injection, n = 120 embryos for pak2a Δ14 with PAK2‐E253A injection, n = 232 embryos for pak2a Δ14 with PAK2‐K278R injection. Scale bar: 200 µm (B,C), 100 µm (D). |