
|
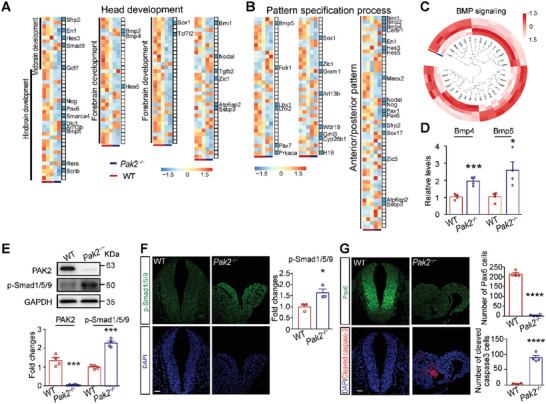
Figure 2
Pak2 −/− mouse embryos exhibit upregulated BMP signaling. A,B) GO analysis indicates that DEGs are enriched in head development and pattern specification processes. Blue bars indicate NTD‐related genes. Scale bar: transcripts per million (TPM) after log2 transforms and Z‐score normalization. C) DEGs that are closely related to BMP signaling in Pak2 −/− embryos. D) The levels of key components of BMP signaling, including Bmp4 and Bmp5, in WT and Pak2 −/− embryos at E9.5. Bmp4: t (6) = 6.112, p = 0.0009; Bmp5: t (6) = 3.06, p = 0.0222. n = 4 embryos for each genotype. E) The level of PAK2 and p‐Smad1/5/9 (Ser465) in Pak2 −/− embryos as shown via western blotting (for PAK2, WT, 1.347 ± 0.151; Pak2 −/− mice, 0.059 ± 0.009; t (6) = 8.542, p = 0.0001; for p‐Smad1/5/9, WT, 1 ± 0.057; Pak2 −/− mice, 2.272 ± 0.109; t (6) = 10.35, p < 0.0001) of the hindbrain of embryos at E9.5. n = 4 embryos for each genotype. F) The level of p‐Smad1/5/9 (Ser465) in Pak2 −/− mice as shown via immunofluorescence analysis of the hindbrain of embryos at E9.5. WT, 1 ± 0.106; Pak2 −/− mice, 1.632 ± 0.170; t (4) = 3.161, p = 0.034. n = 3 embryos for each genotype. G) The numbers of Pax6‐positive cell (WT, 214.3 ± 6.921; Pak2 −/− mice, 4.5 ± 2.021; t (6) = 29.09, p < 0.0001) and cells stained with cleaved caspase‐3 (WT, 3.250 ± 0.750; Pak2 −/− mice, 88.25 ± 7.028; t (6) = 12.03, p < 0.0001) in the hindbrain of WT and Pak2 −/− embryos at E9.5. n = 4 embryos for each genotype. Unpaired t test. Scale bar: 20 µm.