
|
Figure 6
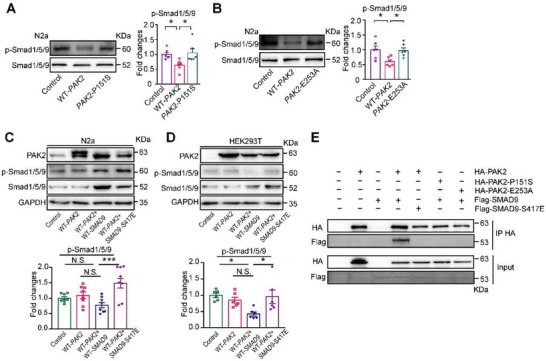
PAK2 regulates Smad9 phosphorylation to inhibit BMP signaling. A) The levels of p‐Smad1/5/9 (Ser 465) (F (2, 15) = 5.185, p = 0.019; for WT‐PAK2 versus PAK2‐P151S, p = 0.0185) in N2a cells transfected with WT‐PAK2 and PAK2‐P151S. n = 6 cultures for each group. B) The levels of p‐Smad1/5/9 (Ser 465) (F (2, 15) = 5.33, p = 0.018; for WT‐PAK2 versus PAK2‐E253A, p = 0.029) in N2a cells transfected with WT‐PAK2 and PAK2‐E253A. n = 6 cultures for each group. C) The levels of p‐Smad1/5/9 (Ser465) in N2a cells overexpressing WT‐PAK2, WT‐PAK2/WT‐SMAD9, and WT‐PAK2/SMAD9‐S417E plasmids. F (3, 28) = 7.393, p = 0.0009; for WT‐PAK2/WT‐SMAD9 versus WT‐PAK2/SMAD9‐S417E, p = 0.0004, n = 8 cultures for each group. D) The levels of p‐Smad1/5/9 (Ser465) in HEK293T cells overexpressing WT‐PAK2, WT‐PAK2/WT‐SMAD9, and WT‐PAK2/SMAD9‐S417E plasmids. F (3, 20) = 4.833, p = 0.011, WT‐PAK2/WT‐SMAD9 versus WT‐PAK2/SMAD9‐S417E, p = 0.025. n = 6 cultures for each group. E) Coimmunoprecipitation of Smad9 with PAK2, whereas SMAD9‐S417E, PAK2‐P151S, and PAK2‐E253A fail to interact with PAK2 and Smad9, respectively. One‐way ANOVA with Dunnett's multiple comparison test (A,B) and with Tukey's multiple comparison test (C,D).