
- Title
-
Depletion of Alpha-Melanocyte-Stimulating Hormone Induces Insatiable Appetite and Gains in Energy Reserves and Body Weight in Zebrafish
- Authors
- Hsieh, Y.W., Tsai, Y.W., Lai, H.H., Lai, C.Y., Lin, C.Y., Her, G.M.
- Source
- Full text @ Biomedicines
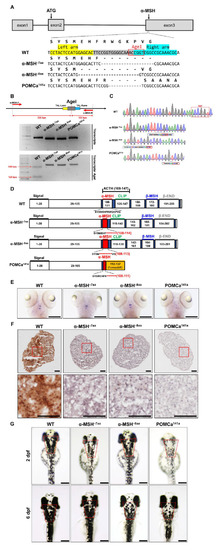
Generation of zebrafish pomca mutants using TALEN. (A) Schematics of the three pomca mutant alleles generated. The sequences in the third exon that were targeted by the TALEN pairs are shown in gray boxes. The AgeI restriction enzyme recognition site for genotyping purposes is shown in a red box; dashed lines indicate deleted nucleotides. The left and right TALEN targeting sites are highlighted in yellow and sky blue, respectively. (B) Upper: Schematic illustration of the primers used for RT–qPCR detection of mutations. The specific primer is to the mutated site/scheme of the locations of primers (red arrows) designed to detect a disruption in the spacer of the third exon. Yellow box, left TALEN sites (TAL-L); sky blue box, right TALEN sites (TAL-R); grey box, spacer; red dashed line, AgeI restriction site. Lower: Results of RT–qPCR analyses on fin clips of heterozygous F1 fish containing one of the corresponding mutations (as indicated in A). (C) Chromographs illustrating the sequences in the third exon of the pomca WT controls and the nucleotide deletion of pomca mutants. The boxed sequence in red indicates the restriction enzyme AgeI cutting sites in WT controls that were deleted in the mutant fish. (D) These diagrams show the predicated Pomca protein of pomca mutants compared with the WT Pomca protein. (E) Whole-mount ISH showing the expression of pomca transcripts in the pituitary in WT controls and pomca mutants larvae at 5 dpf. Scale bars = 200 μm. (F) Expression patterns of α-MSH in 12 mpf Pomc neuron samples after Immunohistochemistry-frozen section (IHC-F) staining. Scale bar = 50 μm. (G) Dorsal view of 2 dpf and 6 dpf pomca mutant larvae. Scale bars = 200 μm. |
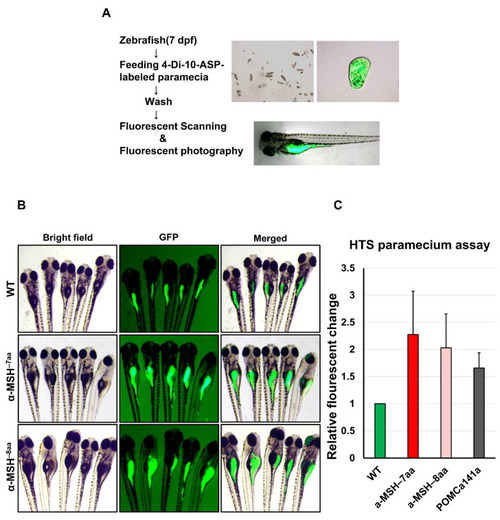
A qualitative food intake assay for zebrafish pomca mutant larvae. (A) Schematic representation of the feeding assay. Fluorescent intensities after free-feeding of 4-10-Di-ASP-labeled paramecia. Fluorescent intensities of ingested paramecia were at maximum levels 1.5 h after feeding (see Methods). (B) Side views of 7 dpf larvae examined under fluorescence illumination. The larvae were incubated with fluorescent microspheres coated with fish food for up to 1.5 h before visualizing the fluorescent contents in their gut. (C) Correlation between the relative amount of paramecia and fluorescent intensities of ingested paramecia in zebrafish. The fluorescent intensities were measured from the numbers of introduced paramecia thrice independently. All values are the mean ± SEM, n = 50. |
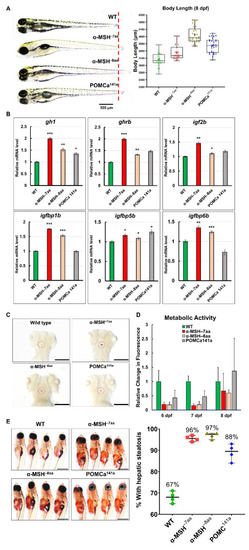
The level of α-MSH regulates normal somatic growth and energy balance in zebrafish embryos/larvae. (A) Left: Lateral view of wild-type and pomca mutant larvae at 8 dpf. Scale bar = 500 μm. Right: Statistical analysis of BL (jaw to tail fin) in WT controls and pomca mutant larvae at 8 dpf. Data are shown as the mean ± SD (n = 30). (B) Expression of GH/IGF axis genes, gh1, ghrb, igf2b, igfbp1b, igfbp15b, and igfbp6b, in WT controls and pomca mutants larvae at 8 dpf. Values are the mean ± SEM. * p < 0.05, ** p < 0.01, and *** p < 0.001 compared with WT groups. (C) Whole-mount ISH showing the increased expression of gh1 in the pituitary in pomca mutants larvae at 5 dpf. Scale bars = 200 μm. (D) Response to depletion of α-MSH in pomca mutant larvae by the Alamar Blue assay. Three larvae per well were incubated in 4 mM sodium bicarbonate with 1% Alamar Blue. The fluorescence of the solution was measured at different time points. Data are reported as the relative change in fluorescence intensity at least three times independently. (mean ± SEM, n = 30). (E) Left: Hepatic steatosis was observed by whole-body Oil Red O staining in pomca mutant larvae at 21dpf. Right: Percentages of WT and pomca mutant larvae with strong levels of hepatic steatosis at 21 dpf were calculated from at least 50 fish in each group. Data were representative of four independent experiments. Scale bar = 1 mm. |

The level of α-MSH regulates somatic growth and sexual size dimorphism in pomca mutant adults. (A,B) Lateral view of F2 homozygous male (A) and female (B) mutants compared with WT controls at 12 mpf. Scale bars = 1 cm. (C) BW curves of zebrafish from the juvenile to adult stages in the three experimental male groups (WT, α-MSH−7aa, and α-MSH−8aa; n = 20/group). (D) Bar graph showing the BWs in the three experimental male groups (n = 20/group) under normal feeding conditions at 4 and 10 mpf stages. (E) Whole mounts of viscera and visceral fat pads in the α-MSH−7aa and α-MSH−8aa fish groups at 12 mpf, showing increased fat pad size in the α-MSH. (F,G) Histological features of adipose tissue in hematoxylin and eosin (HE)-stained sagittal sections, showing (F) male and (G) female specimens. Left: HE-stained sagittal sections, showing visceral and subcutaneous adipose tissue contents in the three experimental male groups (n = 5/group). Right: Bar graph showing the body fat volume ratios calculated by morphometric analysis of fat on visceral and subcutaneous adipose tissue average size in each experimental group (n = 5 in each group). Values are the mean ± SEM. * p < 0.05, ** p < 0.01, and *** p < 0.001 compared with WT control groups. |
Effects of α-MSH on feeding regulation in the hypothalamus of zebrafish. ( |
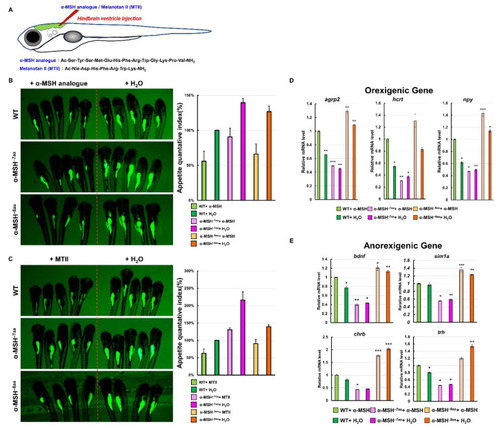
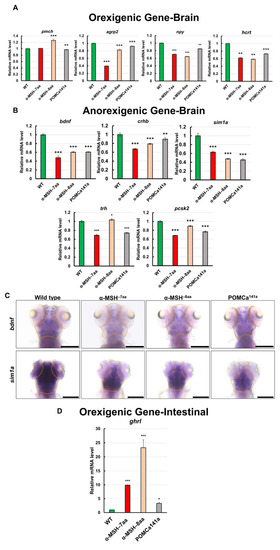
Effects of a synthetic α-MSH analog in rescuing hyperphagic phenotypes in α-MSH mutant larvae. (A) Schematic representation of hindbrain ventricle injection of an α-MSH analog/MTII into α-MSH mutant larvae. (B) α-MSH analog, and (C) MTII. Left: Administration decreased feeding volume in α-MSH mutant larvae at 7 dpf. Right: Bar graph showing the quantified appetite levels measured by morphometric analysis of fluorescent intensities in each experimental group (WT, α-MSH−7aa, and α-MSH−8aa) (n = 50/group). Values are means ± SEM. * p < 0.05, ** p < 0.01, and *** p < 0.001 compared with WT groups. (D,E) RT–qPCR analysis was used to measure the mRNA levels of three selected orexigenic genes, agrp2, npy, and hcrt (D), and four selected anorexigenic genes, bdnf, sim1a, crhb, and trh (E) in the WT and α-MSH mutant larvae at 1.5 h after feeding. We used relative fluorescent change and relative transcriptome expression for quantification three times (n = 50) independently. |

Anorexigenic signals in hypothalamic neural circuits promoted by α-MSH expression in zebrafish. (A) A proposed mechanism that α-MSH mediating food intake and energy expenditure via anorexigenic molecules manipulation which can reversed by α-MSH depletion. (B) Schematic presentation of anorexigenic factors (bdnf, sim1a, crhb, and trh) enhancement within the paraventricular nucleus (PVN) and the ventromedial hypothalamus (VMN) by α-MSH resulting in a dramatic outcome with the anorexigenic phenomenon. |