IMAGE

Figure 5

ID
ZDB-IMAGE-210902-169
Source
Figures for Hsieh et al., 2021
Image
Figure Caption

Figure 5

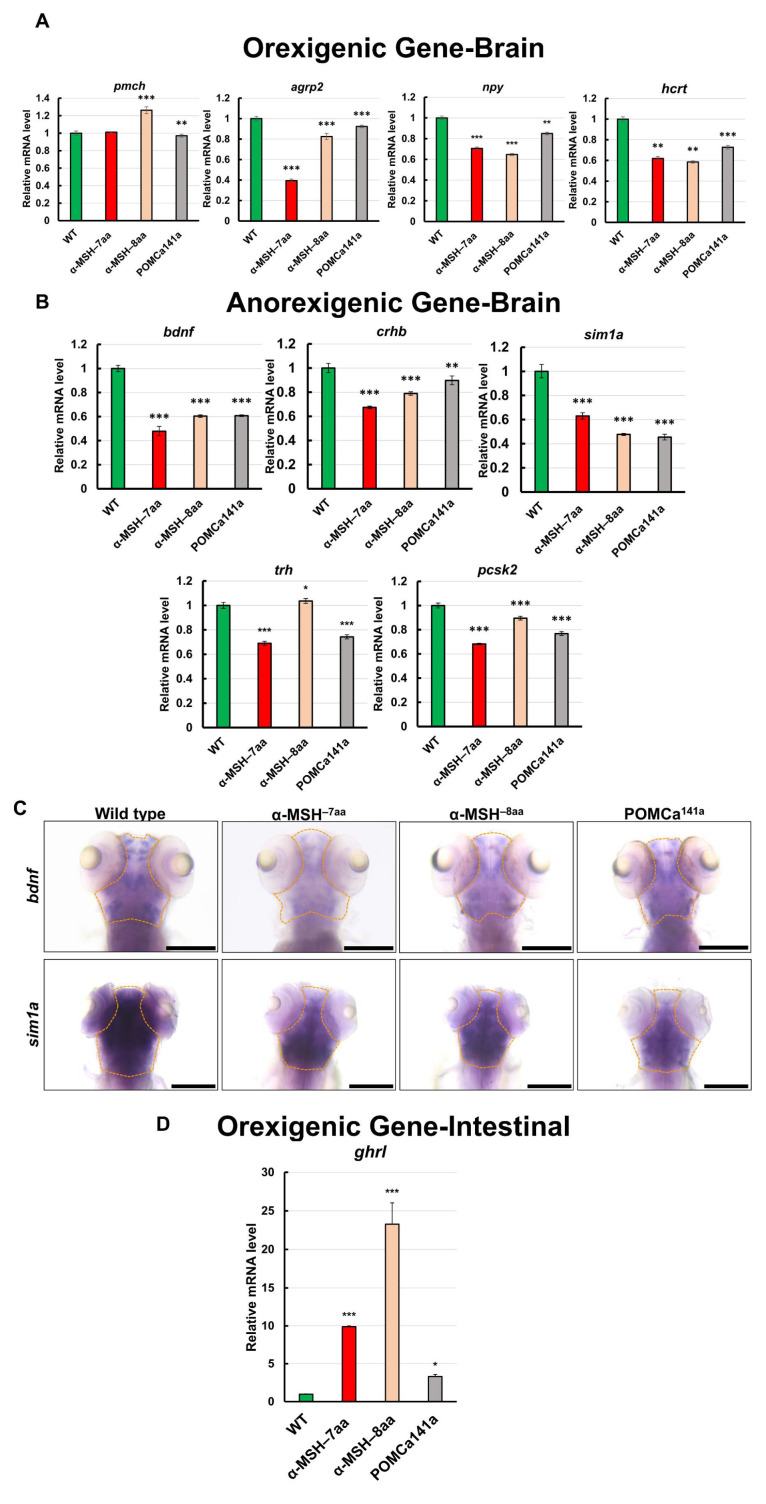
Effects of α-MSH on feeding regulation in the hypothalamus of zebrafish. (A,B) RT–qPCR analysis was used to measure the mRNA levels of four selected orexigenic genes, pmch, agrp2, npy, and hcrt (A), and five selected anorexigenic genes, bdnf, sim1a, crhb, trh, and pcsk2 (B) in the WT and pomca mutants at 1.5 h after feeding. (C) Whole-mount ISH showing decreased expression of bdnf and sim1a in the pituitary in WT and pomca mutant larvae at 5 dpf. Scale bars, 200 μm. (D) RT–qPCR analysis was used to measure the mRNA level of the intestinal orexigenic gene, ghrl, in WT and pomca mutant adults. Values are means ± SEM. * p < 0.05, ** p < 0.01, and *** p < 0.001 compared with WT control groups.

Acknowledgments
This image is the copyrighted work of the attributed author or publisher, and ZFIN has permission only to display this image to its users. Additional permissions should be obtained from the applicable author or publisher of the image. Full text @ Biomedicines