|
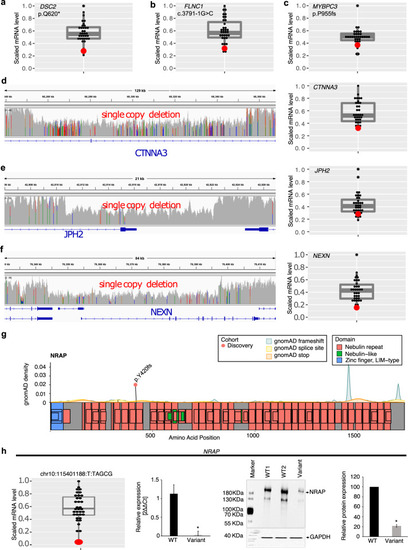
Effect of loss of function and copy number deletions in CMP genes on myocardial gene expression.The figure shows LV myocardial gene expression using RNA sequencing in the patient harboring a loss of function or copy number deletion (red dot) compared to other cases without the variant (gray dots) (n = 35 cases). a–c Three pathogenic loss of function variants predicted to result in nonsense-mediated decay of mRNA. Scaled RPKM expression of target mRNA of variants in DSC2 (stopgain), FLNC (splice acceptor), MYBPC3 (frameshift deletion) are below the 25th percentile compared to the remaining cohort; d–f The left panels show the genomic location of three single CNV deletions in CTNNA3, JPH2, NEXN genes. The right panels show scaled RPKM expression of target mRNA below the 25th percentile compared to the remaining cohort. g Location of loss of function variant in NRAP (ENST00000359988) in the discovery cohort (orange dot). gnomAD background density maps of frameshift, splice site, and premature stop variants are shown. h Myocardial NRAP expression: RNA-seq analysis demonstrated low NRAP mRNA expression (<75th percentile) in the LV myocardium of a DCM patient harboring a homozygous frameshift variant (chr10:115401188_T/TAGCG) (red dot) compared to 34 CMP patients without the variant (black dots). The boxplot shows median expression for the cohort, 25th and 75th percentiles, and lower and upper limit values. qRT-PCR confirmed the reduction of NRAP mRNA expression in patients with the variant compared to 2 CMP patients without the variant i.e., WT (*p < 0.05 vs. WT). Western blot confirmed downregulation of NRAP protein expression in the patient with the variant compared to three CMP patients without the variant on representative Western blot images (*p < 0.05 vs. WT). RPKM reads per kilobase of transcript, per Million mapped reads, gnomAD Genome Aggregation Database, WT wild-type, mut mutant, 2ΔΔCt the relative fold change in mRNA abundance between samples as a function of polymerase chain reaction thresholds.
|