FIGURE SUMMARY
Title

Whole genome sequencing delineates regulatory, copy number, and cryptic splice variants in early onset cardiomyopathy

Authors
Lesurf, R., Said, A., Akinrinade, O., Breckpot, J., Delfosse, K., Liu, T., Yao, R., Persad, G., McKenna, F., Noche, R.R., Oliveros, W., Mattioli, K., Shah, S., Miron, A., Yang, Q., Meng, G., Yue, M.C.S., Sung, W.W.L., Thiruvahindrapuram, B., Lougheed, J., Oechslin, E., Mondal, T., Bergin, L., Smythe, J., Jayappa, S., Rao, V.J., Shenthar, J., Dhandapany, P.S., Semsarian, C., Weintraub, R.G., Bagnall, R.D., Ingles, J., Genomics England Research Consortium, Melé, M., Maass, P.G., Ellis, J., Scherer, S.W., Mital, S.
Source
Full text @ NPJ Genom Med

Yield of protein-coding and regulatory variants in 209 unrelated childhood CMP cases.

a Flow-chart showing the selection process and yield of protein-coding and regulatory variants in the overall cohort and in the gene-elusive subset. Totally, 39% of all cases harbored at least one pathogenic protein-coding variant in a CMP gene; among the remaining 128 gene elusive cases, 15% harbored at least one prioritized high-risk regulatory variant in a CMP gene; and an additional 5% harbored an LoF variant in a new candidate CMP gene. b Pie diagram showing the distribution of protein-coding and regulatory variants in CMP genes and LoF variants in new CMP genes across the cohort (n = 209). WGS identified putatively pathogenic protein-coding SNVs/indels/CNVs in CMP genes in 39% of cases, high-risk variants in regulatory elements of CMP genes in an additional 15% of cases, and loss of function (LoF) variants in candidate genes in an additional 5% of cases. c Variant distribution by CMP subtypes: HCM cases had a higher yield of pathogenic protein-coding variants compared to other CMP subtypes (odds ratio 2.8, CI: 1.5–5.2, p = 7.07 × 10−4). d Variant burden by the patient: 9 cases (4.3%) had multiple protein-coding variants in known CMP genes, 2 cases (1.0%) had multiple prioritized regulatory variants, and 21 cases (10.0%) had both protein-coding and regulatory variants in CMP genes. Regulatory variants in all cases were further prioritized if they were active in human LV, were rare in control subpopulations (Popmax AF < 0.1%), and were associated with genes enriched in cases versus controls with OR ≥ 1.3. e Variant distribution by functional gene categories: of all the pathogenic protein-coding variants, 66% was in sarcomere genes which represented a significant enrichment compared to other gene categories (binomial p = 3.99 × 10−29). Conversely, none of the high-risk regulatory variants were in sarcomere genes. Tier 1 gene and primary CMP gene classifications are denoted by plus symbols. CMP cardiomyopathy, SNV single nucleotide variant, CNV copy number variant, gnomAD Genome Aggregation Database, ACMG American College of Medical Genetics; Association for Molecular Pathology (AMP), TFBS transcription factor binding site, P/LP pathogenic or likely pathogenic, LoF loss of function, HCM hypertrophic cardiomyopathy, DCM dilated cardiomyopathy.

Effect of loss of function and copy number deletions in CMP genes on myocardial gene expression.

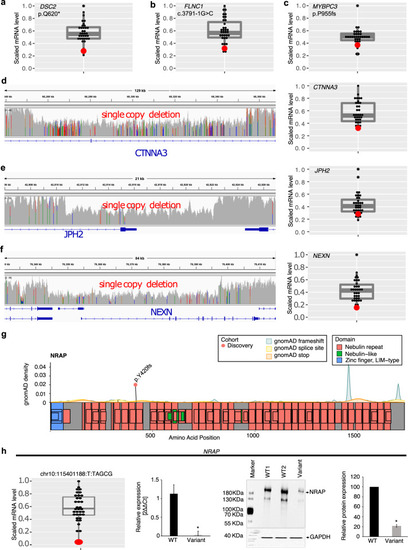
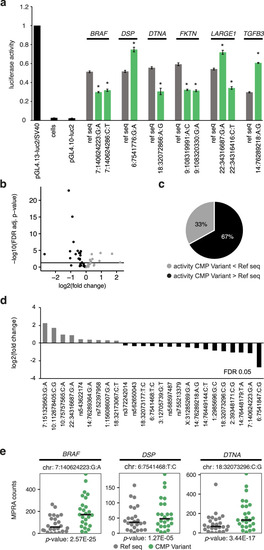
The figure shows LV myocardial gene expression using RNA sequencing in the patient harboring a loss of function or copy number deletion (red dot) compared to other cases without the variant (gray dots) (n = 35 cases). ac Three pathogenic loss of function variants predicted to result in nonsense-mediated decay of mRNA. Scaled RPKM expression of target mRNA of variants in DSC2 (stopgain), FLNC (splice acceptor), MYBPC3 (frameshift deletion) are below the 25th percentile compared to the remaining cohort; df The left panels show the genomic location of three single CNV deletions in CTNNA3, JPH2, NEXN genes. The right panels show scaled RPKM expression of target mRNA below the 25th percentile compared to the remaining cohort. g Location of loss of function variant in NRAP (ENST00000359988) in the discovery cohort (orange dot). gnomAD background density maps of frameshift, splice site, and premature stop variants are shown. h Myocardial NRAP expression: RNA-seq analysis demonstrated low NRAP mRNA expression (<75th percentile) in the LV myocardium of a DCM patient harboring a homozygous frameshift variant (chr10:115401188_T/TAGCG) (red dot) compared to 34 CMP patients without the variant (black dots). The boxplot shows median expression for the cohort, 25th and 75th percentiles, and lower and upper limit values. qRT-PCR confirmed the reduction of NRAP mRNA expression in patients with the variant compared to 2 CMP patients without the variant i.e., WT (*p < 0.05 vs. WT). Western blot confirmed downregulation of NRAP protein expression in the patient with the variant compared to three CMP patients without the variant on representative Western blot images (*p < 0.05 vs. WT). RPKM reads per kilobase of transcript, per Million mapped reads, gnomAD Genome Aggregation Database, WT wild-type, mut mutant, 2ΔΔCt the relative fold change in mRNA abundance between samples as a function of polymerase chain reaction thresholds.

Regulatory variant burden in cases (<italic>n</italic> = 209) and controls (<italic>n</italic> = 1326).

a There was a significant enrichment of high-risk regulatory variants in CMP genes in the cases (orange) compared to controls (blue) (OR 2.25, 95% CI: 1.65–3.07, p = 6.70 × 10−7). b Burden of regulatory variants genes in cases in the discovery and 100,000 Genomes Project cohorts versus controls. Top 4 genes enriched for regulatory variants compared to controls included FKTN (OR = 58.1, CI: 3.1–1083), DTNA (OR = 6.7, CI: 3.0–14.8), DSC2 (OR = 32.0, CI: 1.5–668) and DSG2 (OR = 10.6, CI: 1.4–81). Tier 1 gene and primary CMP gene classifications are denoted by plus symbols. c Replication cohort (n = 1266): scatter plot showed a positive correlation between genes enriched for high-risk regulatory variants in the CMP discovery cohort vs the 100,000 Genomes Project replication cohort (Spearman ρ2 0.555, p = 0.000936) with the top genes being similar in both CMP cohorts (FKTN, DTNA, DSC2, DSG2).

Target gene and protein expression in the LV myocardium of patients harboring regulatory variants.

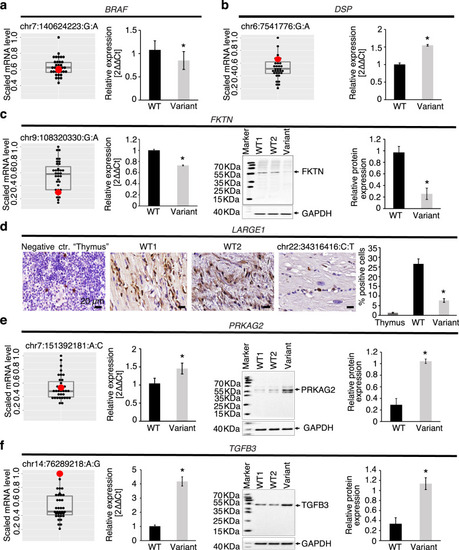
RNA Seq, qRT-PCR, Western blot, and immunohistochemistry were performed in available LV myocardium from CMP patients (n = 35) to detect mRNA and protein expression of target genes in patients harboring regulatory variants in BRAF, DSP, FKTN, LARGE1, PRKAG2, or TGFB3. For RNA sequencing data, the target scaled RPKM gene expression was compared between the patient harboring the variant (red dot) and the remainder of the cohort (black dots) using boxplots showing median expression for the cohort, 25th and 75th percentiles, and maximum and minimum values (n = 35). For qRT-PCR, Western blot, and immunohistochemistry, target gene or protein expression in the LV myocardium of the patient harboring the variant was compared to wild-type controls including an autopsy sample from an individual without cardiac disease as well as one or more CMP patients that did not harbor any known pathogenic coding or regulatory variants. Three independent experiments were performed per sample with each experiment including three technical replicates per sample. Protein expression level of GAPDH as a house keeping gene was used as a loading control for Western blots. Error bars indicate standard deviation between the averages of each independent experiment. aBRAF: Promoter variant chr7:140624223_G/A was associated with normal BRAF mRNA expression on RNAseq, but reduced BRAF mRNA expression on qRT-PCR. Promoter variant chr7:140624286_C/T was associated with increased mRNA expression on RNAseq (>75th percentile). bDSP: Promoter variant (chr6:7541776_G/A) was associated with increased DSP mRNA expression on RNAseq (>75th percentile), and on qRT-PCR (*p < 0.05 vs. controls). cFKTN: Promoter variant 1 (chr9:108320330_G/A) was associated with reduced FKTN mRNA expression on RNAseq (<75th percentile), reduced mRNA expression on qRT-PCR (p < 0.05 vs. controls), reduced protein expression on Western blot representative images, and reduced relative protein abundance on quantification (*p < 0.05 vs. controls). dLARGE1: Promoter variant chr22:34316416_C/T was associated with lower perinuclear staining for LARGE1 (brown) (nuclear staining, blue) on representative immunohistochemistry images, and lower % of LARGE1 positive cells in patient myocardium (*p < 0.05 vs. controls). Thymic tissue was used as a negative control. Scale bar = 20 µm. ePRKAG2: Enhancer variant chr7:151392181_A/C was associated with normal PRKAG2 mRNA expression on RNAseq, but higher mRNA expression on qRT-PCR (*p < 0.05 vs. controls), higher protein expression on Western blot representative images, and higher relative protein expression on quantification (*p < 0.05 vs. controls). fTGFB3: Enhancer variant (chr14:76289218_A/G) was associated with higher TGFB3 mRNA expression on RNAseq, higher mRNA expression on qRT-PCR (*p < 0.05 vs. controls), higher protein expression on Western blot representative images, and higher relative protein abundance on quantification (*p < 0.05 vs. controls). RNA Seq RNA sequencing, WT wild-type, 2ΔΔCt the relative fold-change in mRNA abundance between samples as a function of polymerase chain reaction thresholds.

Reporter assays in human iPSC-cardiomyocytes.

a Luciferase reporter assay showing the effect of regulatory variants on transcription. The cloned promoter variants of BRAF (chr7:140624223_G/A), DTNA (chr18:32072866_A/G), FKTN (chr9:108319991_A/C, chr9:108320330_G/A), and LARGE1 (chr22:34316416_C/T) reduced luciferase activity compared to reference sequences. The promoter variant of DSP (chr6:7541776_G/A), a second promoter variant of LARGE1 (chr22:34316687_G/A), and an enhancer variant of TGFB3 (chr14:76289218_A/G) significantly increased luciferase activity compared to reference sequences. *p < 0.05 versus reference sequence. All luciferase reporter assays were performed with three biological replicates, each with three technical replicates. b Volcano plot representing the effect of 46 regulatory variants on gene expression using MPRA. Twenty-five variants had significant differences in transcriptional activity between reference and alternative allele (FDR < 0.05, represented by the horizontal black line). Gray = CMP variant activity less than reference allele; black = CMP variant activity more than reference allele. c Totally, 67% of significant variants were associated with higher transcription activity of the reference allele. d Log2-fold transcriptional activity changes between alternative and reference allele sequences. e Representative graphs of MPRA counts of alternative allele (green) versus reference allele sequences (gray) of BRAF (chr7:140624223_G/A), DSP (chr6:7541468_T/C), and DTNA (chr18:32073296_C/G). All MPRA assays were performed in five independent biological replicates. MPRA massively parallel reporter assay, ref seq reference allele sequence, FDR false discovery rate, CMP cardiomyopathy.

ZFIN is incorporating published figure images and captions as part of an ongoing project. Figures from some publications have not yet been curated, or are not available for display because of copyright restrictions.

Acknowledgments
This image is the copyrighted work of the attributed author or publisher, and ZFIN has permission only to display this image to its users. Additional permissions should be obtained from the applicable author or publisher of the image. Full text @ NPJ Genom Med