
- Title
-
baz1b loss-of-function in zebrafish produces phenotypic alterations consistent with the domestication syndrome
- Authors
- Torres-Pérez, J.V., Anagianni, S., Mech, A.M., Havelange, W., García-González, J., Fraser, S.E., Vallortigara, G., Brennan, C.H.
- Source
- Full text @ iScience
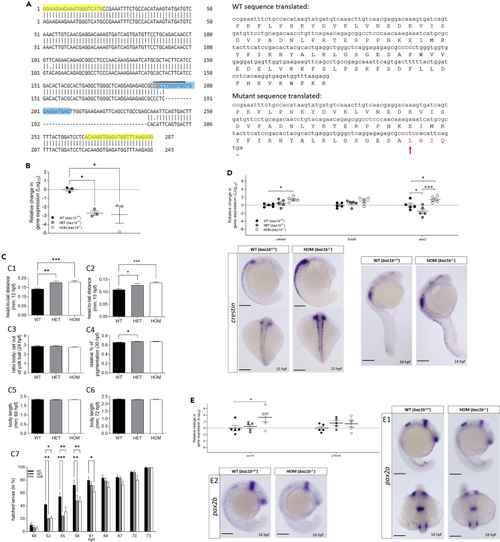
Deficits in baz1b lead to mild neurocristopathy in zebrafish (A) Left panel shows a DNA blast for the portion of baz1b′s exon 5 amplified by PCR used for genotyping between WT (above) and mutants (below, 44 bp deletion). Primers used are highlighted in yellow, crRNA site in blue, PAM site in gray and restriction enzyme over-lined. Right panel shows the in-frame translation to amino acids (aa) sequences in WT (above) and mutants (below) of the same exon 5 portion. Arrow indicates mutation starting site, changed aa are in red and stop codon marked as a dash (−). (B) Relative change in gene expression (log10) assessed by qPCR between 5 dpf larvae from each genotype showing that in both HET and HOM the expression of baz1b is significantly diminished with respect to WT. Figure shows individual values (N = 3 per genotype, each representing a group of 16 larvae combined) and mean ± SE mean (SEM). (C) Developmental comparison between the three phenotypes for the head-to-tail distance at 12 (C1) and at 15 hpf (C2), ratio body/tail-out-of-yolk-ball at 24 hpf (C3), relative percentage of pigmentation at 30 hpf (C4), body length at 60 (C5) and at 72 hpf (C6), and percentage of hatched larvae between 49 and 73 hpf (C7). (D) Relative change in gene expression (log10) for crestin, foxd3, and sox2 from each genotype at 24 hpf. Below panel shows whole larvae in situ hybridization (WISH) against crestin for WT and HOM at 18 and 24 hpf. (E) Relative change in gene expression (log10) for sox10 and p75ntrb from each genotype at 24 hpf with WISH against pax2a (E1) and pax2b (E2), genes regulated by baz1b. Graphs show mean ± SEM. In all cases: ∗p < 0.05; ∗∗p < 0.01; ∗∗∗p < 0.001; +++ p < 0.001. Statistical test: one-way ANOVA with Tukey correction for multiple comparison for B, C2, C4, C5, D, and E; non-parametric test of Kruskal-Wallis corrected for multiple comparison for C1, C3, and C6; two-way ANOVA with repeated measures with Tukey correction for multiple comparison for C7. Scale bars represent 200 μm. |

baz1b LoF zebrafish have altered craniofacial features (A) Comparison between genotypes for the cranial features (outlined in the picture below) observed at 5 dpf by Alcian blue staining: ratio 1/2 (A1), ratio 1/3 (A2), ratio 1/4 (A3), ratio 2/3 (A4), ratio 2/4 (A5), and ratio 5/6 (A6). (B) Morphological comparisons of intact 5 dpf for the three genotypes: body length (BL, in mm; B1), eye length (EL) normalized to BL (B2), eye width (EW) normalized to BL (B3), head width (HW) normalized to BL (B4), inter-ocular distance (IOD) normalized to BL (B5), and eye-snout distance (ESD) normalized to BL (B6). (C) Morphological comparison of intact juvenile fish (30 dpf). Graphs show mean ± SEM. In all cases: ∗p < 0.05; ∗∗p < 0.01; ∗∗∗p = 0.001; ∗∗∗∗p < 0.001. Statistical test: one-way ANOVA with Tukey correction for multiple comparison for A1, A3, A5, A6, B2–B6, and C1–C6; non-parametric test of Kruskal-Wallis corrected for multiple comparison for A2, A4, and B1. |
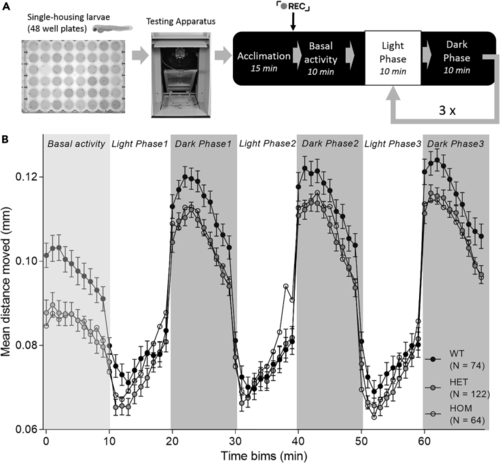
Loss of baz1b leads to faster habituation in the forced light-dark transition (FLDT) assay (A) Diagram of the assay. (B) Mean distance moved per genotype during the baseline and the three light-dark cycles (10 min each). Note that both HET and HOM describe a steeper slope than WT sibling during the light phases. Data show mean ± SEM. |

Loss of baz1b diminishes stress response and habituation in the flash of light and acoustic startle assay (A) Diagram of the assay. (B) Flash of light: total distance moved during the flash of light (time 0) and 2 s after. Dots represent distance traveled in 1 s time bins (B1), and mean distance moved during recovery for the 18 s following this period (B2). Dots represent 1 s time bins. (C) Acoustic startle assay: total distance moved 25 s before and during the acoustic cues (C1) and proportion of responders during the acoustic cues (C2). In all cases, data show mean ± SEM. Intragroup variations in N number are due to statistical exclusion criteria applied at each time bin. |

Novel tank diving assay shows anxiolytic phenotype in baz1b LoF zebrafish (A) Changes in distance traveled for the three genotypes in the novel tank diving assay divided in 30 s time beams. (B) Distance to the bottom of the assay in each 30 s for the three genotypes. (C) Fraction of time in the bottom third and D) top half visits for the three genotypes during the novel tank diving assay. Graphs show mean ± SEM. Intragroup variations in N number are due to statistical exclusion criteria applied at each time bin. |
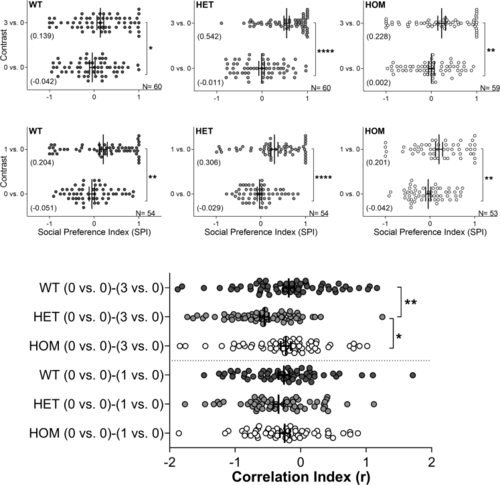
Loss of baz1b disturbs the ontogeny of sociability in zebrafish Graphs show change in social preference index (SPI) between basal conditions (0 vs. 0) and contrast (0 vs. 3 or 0 vs. 1) for either WT, HET, or HOM at week 2 of age (for week 1 and 3 see Figure S6). N is included in each graph. Below panel shows the comparison of the correlation indexes for all the contrast at week 2 (from 13 to 15 dpf). Graphs show individual values and mean (also between brackets for SPI) ± SEM. In all cases: ∗p < 0.05; ∗∗p < 0.01; ∗∗∗∗p < 0.001. Statistical test: non-parametric two-tailed Wilcoxon signed-rank test of paired samples for SPIs; non-parametric test of Kruskal-Wallis of not paired samples with Dunn’s correction for multiple comparisons for correlation index. |