
|
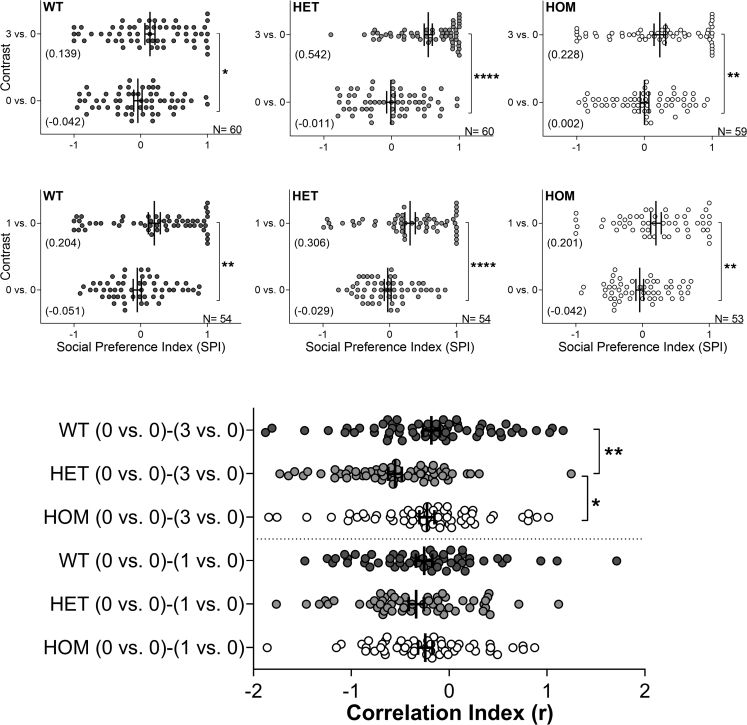
Fig. 6
Loss of baz1b disturbs the ontogeny of sociability in zebrafish
Graphs show change in social preference index (SPI) between basal conditions (0 vs. 0) and contrast (0 vs. 3 or 0 vs. 1) for either WT, HET, or HOM at week 2 of age (for week 1 and 3 see Figure S6). N is included in each graph. Below panel shows the comparison of the correlation indexes for all the contrast at week 2 (from 13 to 15 dpf). Graphs show individual values and mean (also between brackets for SPI) ± SEM. In all cases: ∗p < 0.05; ∗∗p < 0.01; ∗∗∗∗p < 0.001. Statistical test: non-parametric two-tailed Wilcoxon signed-rank test of paired samples for SPIs; non-parametric test of Kruskal-Wallis of not paired samples with Dunn’s correction for multiple comparisons for correlation index.