
Fig. 5
- ID
- ZDB-FIG-231208-20
- Publication
- Dogra et al., 2023 - kcna1a mutant zebrafish model episodic ataxia type 1 (EA1) with epilepsy and respond to first-line therapy carbamazepine
- Other Figures
- All Figure Page
- Back to All Figure Page
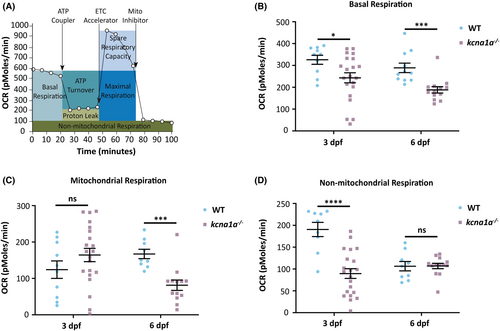
Metabolic characterization of kcna1a−/− zebrafish. (A) Schematic representation of how the Seahorse bioanalyser displays mitochondria bioenergetics as regulated by pharmacological inhibitors. (B) Quantification of basal respiration. kcna1a−/− exhibit a significant reduction in basal respiration compared to WT at 3 dpf and 6 dpf. WT, n = 10; kcna1a−/−, n = 21 at 3 dpf. WT, n = 11; kcna1a−/−, n = 13 at 6 dpf. (C) Quantification of mitochondrial respiration. kcna1a−/− exhibit a significant reduction in mitochondrial respiration compared to WT at 6 dpf. WT, n = 10; kcna1a−/−, n = 21 at 3 dpf. WT, n = 9; kcna1a−/−, n = 13 at 6 dpf. (D) Quantification of non-mitochondrial respiration. kcna1a−/− exhibit a significant reduction in non-mitochondrial respiration compared to WT at 3 dpf. WT, n = 19; kcna1a−/−, n = 21 at 3 dpf. WT, n = 9; kcna1a−/−, n = 13 at 6 dpf. Data are mean ± SEM, ns: no significant changes observed, *p ≤ .05, ***p ≤ .001, ****p ≤ .0001- Unpaired t test. OCR, oxygen consumption rate. |