
FIGURE
Fig. 6
Fig. 6
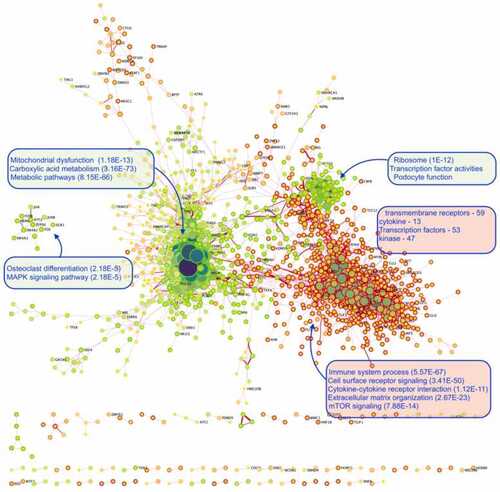
Overall network model using the most significant MI scores visualized by means of a force-directed layout, revealing several clusters in the network. The most prominent biological functions were used to annotate the clusters. Nodes in the network represent the genes, and edges (lines) represent the correlations, measured as mutual information values. Each node border color represents the fold-change in the gene expression in DN conditions. The node size represents the connection to other genes (hubs), and the thickness of the edges represents the strength of the association between genes. |
Expression Data
Expression Detail
Antibody Labeling
Phenotype Data
Phenotype Detail
Acknowledgments
This image is the copyrighted work of the attributed author or publisher, and
ZFIN has permission only to display this image to its users.
Additional permissions should be obtained from the applicable author or publisher of the image.
Full text @ Comput Struct Biotechnol J