
Figure 5.
- ID
- ZDB-FIG-220311-5
- Publication
- Hason et al., 2022 - M-CSFR/CSF1R signaling regulates myeloid fates in zebrafish via distinct action of its receptors and ligands
- Other Figures
- All Figure Page
- Back to All Figure Page
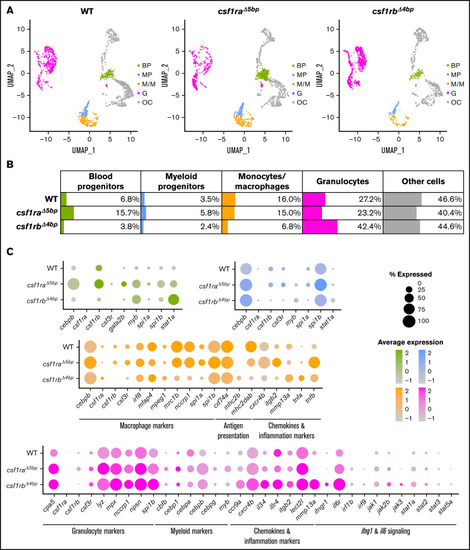
Single-cell RNA sequencing (scRNA-seq) of adult WT, csf1raΔ5bp, and csf1rbΔ4bp WKM cells shows differentially expressed hematopoietic genes. (A-C) WKMs of 1 to 2 animals were pooled for each sample. (A) Clusters in Dim plots represent individual selected populations of WKM hematopoietic cells. The identity of each cluster is based on likely cell origin according to lineage marker gene expression. Green, blood progenitors (BP); blue, myeloid progenitors (MP); orange, monocytes/macrophages (M/M); pink, granulocytes (G); gray, other cells (OC). (B) Table representing the percentage of cells in each population for WT and respective mutants. (C) Dot plot visualization of scRNA-seq gene expression in individual populations of WKM hematopoietic cells of WT and respective mutants. The color of each dot represents the level of expression (also depicted in the histogram), and the size of the dot shows the percentage of cells expressing each individual gene. |