
Fig. 4
- ID
- ZDB-FIG-220131-24
- Publication
- Restuadi et al., 2022 - Functional characterisation of the amyotrophic lateral sclerosis risk locus GPX3/TNIP1
- Other Figures
- All Figure Page
- Back to All Figure Page
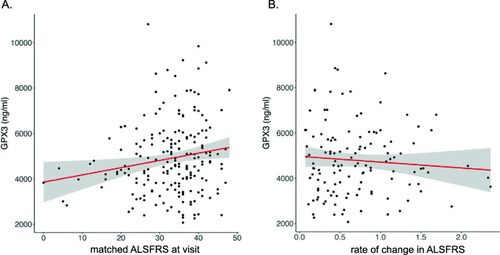
GPX3 protein expression is correlated with clinical measures of ALS function. A Linear regression of ALS functional rating score (matched visit) and GPX3 protein level in plasma (ALSFRS-R, a measure of physical function, high score implies better function) (sex included as a covariate) identifies a positive correlation in ALS cases with functional rating score (ELISA assay, n = 200, p = 0.0055, adjusted R2 = 0.042, y = 3625.4 + 27.4x, SE 13.3). B Linear regression of change in ALSFRS-R per month since time of onset (0 indicates slow progression, 2 indicates fast progression) and GPX3 expression (n = 126, p = 0.025, adjusted R2 = 0.042, y = 4326.7 − 126.3x, SE 284.0) (sex included as a covariate). A similar result was identified in a larger cohort when using proxy dates (when onset date was missing) (Additional file 2: Supplementary Methods) (R2 = 0.031, p = 0.049, for every unit increase rate of progression resulted in a −96 ± 137 ng/ml of GPX3 (mean ± SE) (n = 190) vs. a decrease of −126 ± 284 ng/ml of GPX3 (mean ± SE)) |