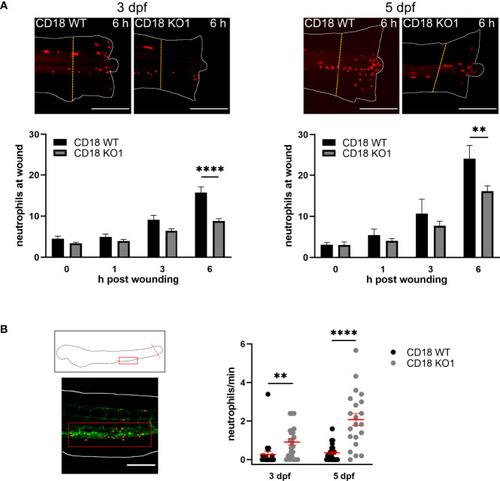
Neutrophil trafficking in CD18 KO zebrafish. (A) Upper panel: Exemplary maximum intensity projections of neutrophil recruitment 6 h after tail fin transection in CD18 WT and CD18 KO1 zebrafish larvae at 3 dpf (left) and 5 dpf (right). Neutrophils are depicted in red. The dashed lines indicate the 200 µm area in which the neutrophils were counted. Scale bars represent 200 µm. Lower panel: Quantification of neutrophil numbers at the transected tail fin in 3 dpf (left) and 5 dpf (right) CD18 WT and CD18 KO1 zebrafish larvae. Mean± sem of ≥ 8 individual larvae of ≥ 2 independent experiments. One-way ANOVA, p < 0.01: **, p < 0.0001: ****. (B) Schematic (upper left panel) and representative microscopic image (lower left panel) of the location of the posterior caudal vein (red box) that was imaged for quantification of circulating neutrophils. The dotted line indicates the tail fin transection. Scale bar represents 200 µm. Right panel: Number of neutrophils per min detected in the circulation 6 h after tail fin transection in CD18 WT and CD18 KO1 zebrafish larvae at 3 dpf and 5 dpf. Mean ± sem of ≥ 21 individual larvae of 3 independent experiments. Unpaired t-test, p < 0.01: **, p < 0.0001: ****.
|
