
FIGURE
Fig. 7
- ID
- ZDB-FIG-090817-32
- Publication
- Moro et al., 2009 - Analysis of beta cell proliferation dynamics in zebrafish
- Other Figures
- All Figure Page
- Back to All Figure Page
Fig. 7
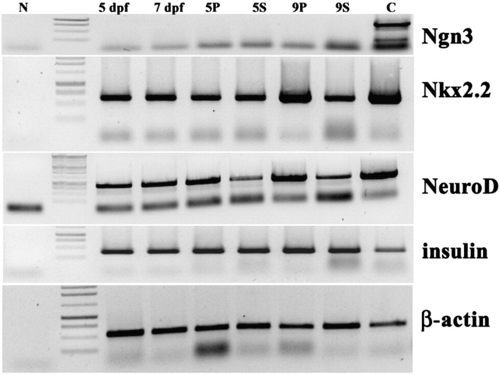
RT-PCR analysis of handpicked islets from zebrafish at different developmental stages. N: Negative control; 5 dpf and 7 dpf: pooled islets at larval stages; 5P and 5S: pooled primary and secondary islets, respectively, from 5 months old fish; 9P and 9S: pooled primary and secondary islets, respectively, from 9 months old fish. C: Pooled whole embryos (n = 50) at 3 dpf. |
Expression Data
| Genes: | |
|---|---|
| Fish: | |
| Anatomical Term: | |
| Stage Range: | Day 5 to Adult |
Expression Detail
Antibody Labeling
Phenotype Data
Phenotype Detail
Acknowledgments
This image is the copyrighted work of the attributed author or publisher, and
ZFIN has permission only to display this image to its users.
Additional permissions should be obtained from the applicable author or publisher of the image.
Reprinted from Developmental Biology, 332(2), Moro, E., Gnügge, L., Braghetta, P., Bortolussi, M., and Argenton, F., Analysis of beta cell proliferation dynamics in zebrafish, 299-308, Copyright (2009) with permission from Elsevier. Full text @ Dev. Biol.