
Fig. 4
- ID
- ZDB-FIG-090324-34
- Publication
- Oka et al., 2009 - The fifth class of Gα proteins
- Other Figures
- All Figure Page
- Back to All Figure Page
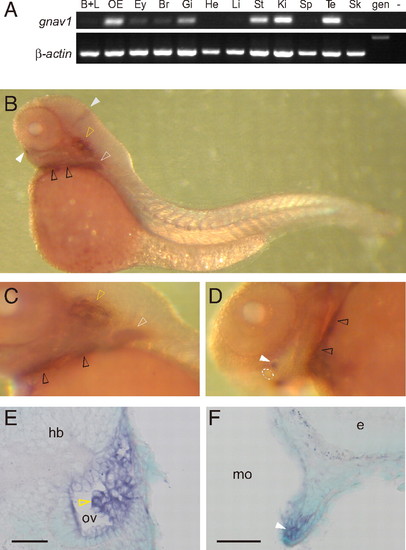
Expression pattern of the zebrafish gnav1 gene. (A) Transcripts for zebrafish gnav1 were detected by RT-PCR using intron-spanning primer pairs. β-Actin was used as a positive control. B+L, barbels and lips; OE, olfactory epithelium; Ey, eye; Br, brain; Gi, gill; He, heart; Li, liver; St, stomach; Ki, kidney; Sp, spleen; Te, testis; Sk, skin; gen, genomic DNA; -, negative control without template DNA. (B–F) Whole-mount in situ hybridization with gnav1 probe. (B and C) Lateral views of the whole larva and posterior part of the head region, respectively. (D) Ventral view of the head region. Dotted circle, mouth. (E and F) Cross-sections after hybridization show expression in the developing inner ear (E) and lower lip (F). Sections were counterstained with methyl green. Dorsal is to the top. White and gray solid arrowheads indicate the cell clusters next to the lower lip and the midbrain–hindbrain boundary, respectively. White, yellow, and black open arrowheads point to labeled cells within pectoral fins, otic vesicle (ov), and branchial arches, respectively. e, eye; hb, hindbrain; mo, mouth cavity. (Scale bars: 50 μm.) |
| Gene: | |
|---|---|
| Fish: | |
| Anatomical Terms: | |
| Stage Range: | Protruding-mouth to Adult |