
- Title
-
Exposure to PFOA and its novel analogs disrupts lipid metabolism in zebrafish
- Authors
- Sun, W., Zhang, X., Qiao, Y., Griffin, N., Zhang, H., Wang, L., Liu, H.
- Source
- Full text @ Ecotoxicol. Environ. Saf.

Representative images of O-Dianisidine staining (a) and Sudan black B staining (b) in zebrafish after 72 hpe exposure to PFOA and alternatives. O-Dianisidine stains mature erythrocyte to reflect abnormalities in the circulatory system, and the green arrows and circles indicates a positive stain, which is dark red. Among them, PFOA, Gen-X was relatively normal, while the HFPO-TA group showed significant erythrocyte retention. n = 7, the lower right corner indicates the number of cases with the same representative image. Sudan black B staining was mainly observed for neutrophil aggregation. The figure shows the aggregation of neutrophils in all three exposure groups, and the red arrows indicate the aggregation in the liver region. n = 10, the lower right corner indicates the number of cases with the same representative image. PHENOTYPE:
|

Changes in lipid metabolism after 72 hpe exposure of PFOA and alternatives in zebrafish. Lipid metabolism biochemical indexes TC (a), TG (b), LDL-C (c), HDL-C (d) after exposure to PFOA and its alternatives; Representative images of neutral lipids and cholesteryl esters stained with Oil Red O (e), The box in the diagram marks the apparently positive stained section. OD 492 nm value of Oil red extracted after staining (f); Filipin staining of free cholesterol, the box in the diagram marks the apparently positive stained section (g) and image J quantification of mean fluorescence intensity (h) results were performed on exposed zebrafish. Biochemical analysis, n = 5, 40 zebrafish per group; Oil red O extraction, n = 5, 3 zebrafish per group; Filipin statistical analysis, n = 4, 4 zebrafish per group. * P < 0.05 compared with the control group. Data are expressed as mean ± SE. PHENOTYPE:
|
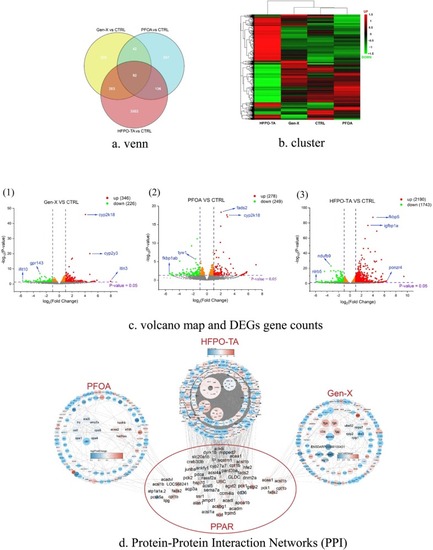
Differential gene analysis of zebrafish exposed to PFOA and its alternatives at 72 hpe. (a) shows the number of shared and unique differential genes between different groups. The heat map indicates the distribution of up- and down-regulated genes and cluster analysis, with up-regulation in red and down-regulation in green (b); Volcano plots indicate the number and distribution of differential genes for PFOA, Gen-X, and HFPO-TA compared with the control group, with blue genes labeled as genes with larger P values or foldchange (c1, 2, 3); Protein-Protein Interaction Networks (PPI) was drawn after 72 hpe exposure of zebrafish with PFOA and its alternatives (d). The STRING database was used to draw PPI, and the most enriched network nodes were screened by MCODE, and the size of nodes was defined by betweenness. EXPRESSION / LABELING:
PHENOTYPE:
|
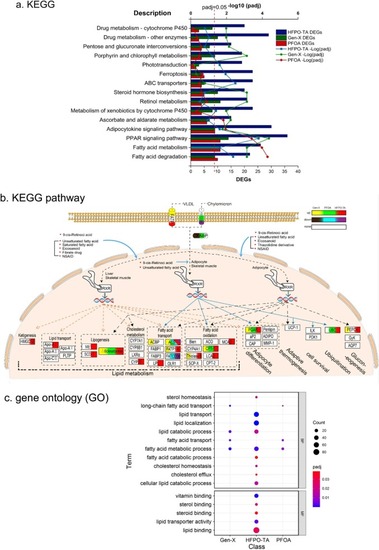
Analysis of differential gene KEGG, gene ontology (GO) enrichment after 72 hpe exposure of zebrafish to PFOA and alternatives. KEGG double Y-axis plot in (a), the bar graph shows the number of enriched differential genes and the line graph shows the Padj values. Among them, the most significant enrichment was in lipid metabolism, degradation and PPAR pathway; the changes of specific factors in PPAR pathway were plotted (b); Bubble charts (c) of Gen-X, PFOA, HFPO-TA differential gene GO analysis compared to controls. GO showed that the more significant functional enrichment was also involved in lipid metabolism related. BP: Biological Process; MF: Molecular Function. PHENOTYPE:
|
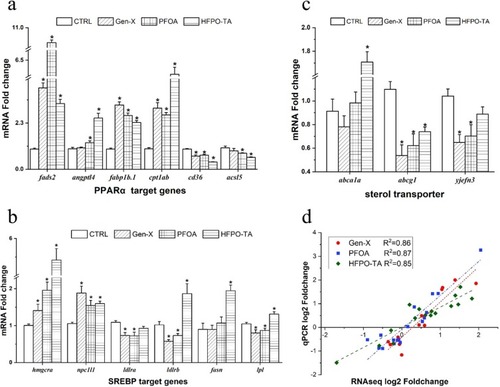
RT-qPCR analysis after 72 hpe exposure of PFOA and alternatives to zebrafish. (a) mRNA expression levels of representative target genes downstream of PPARα; (b) mRNA expression levels of representative target genes downstream of SREBP; (c) mRNA expression levels of sterol transport-related factors; (d) represents the correlation analysis between RNA-seq gene expression level and RT-qPCR, and the adjusted R2 was Gen-X 0.86, PFOA 0.87, HFPO-TA 0.85. n = 5, 30 zebrafish per group; * P < 0.05 compared with control group; data are expressed as mean ± SE. EXPRESSION / LABELING:
PHENOTYPE:
|
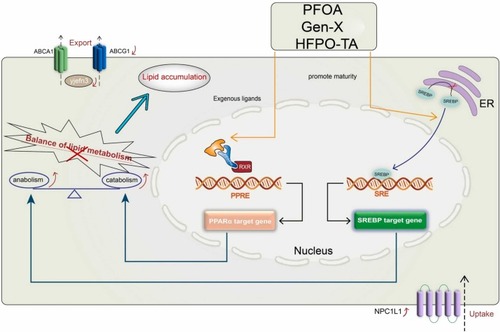
Mechanisms of disorders in lipid metabolism after 72 hpe exposure of PFOA and alternatives in zebrafish. As shown in the figure, activation of PPARα by PFOA and alternatives as exogenous ligands, promoting significant changes in target genes related to lipid metabolism downstream of PPARα; Similarly, PFOA and alternatives promote the maturation of SREBP into the nucleus, causing significant changes in target genes related to lipid metabolism downstream of SREBP. Lipid metabolism catabolism, anabolism is significantly upregulated, disrupting the balance of lipid metabolism and causing lipid retention; Sterol transport related factors npc1l1, abcg1 and yjefn3 (aibp) also changed significantly, which further disturbed the lipid metabolism balance in zebrafish. |