
- Title
-
Transcriptome analysis of the early stage ifnlr1-mutant zebrafish indicates the immune response to auditory dysfunction
- Authors
- Wang, W.Q., Qiu, S.W., Huang, S.S., Wang, G.J., Han, M.Y., Kang, D.Y., Yuan, Y.Y., Gao, X., Dai, P.
- Source
- Full text @ Gene Expr. Patterns

Fig. 1. Fluorescence imaging on E4I4–Mo and control-Mo zebrafish at 7dpf. (A) Fluorescence field: the lateral line of zebrafish is shown in the white box; the white arrows point to the diminished fluorescent signals of neuromasts. (B) Bright field: the red stars mark the uninflated swim bladders. . (For interpretation of the references to color in this figure legend, the reader is referred to the Web version of this article.) PHENOTYPE:
|
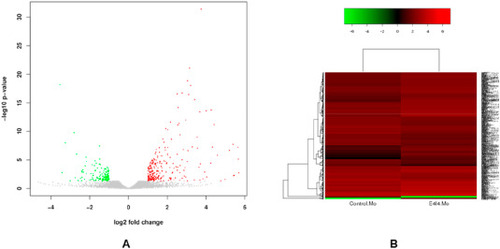
Fig. 2. The volcano plot and heatmap of DEGs. (A) The volcano plot of DEGs: up-regulated DEGs are shown in red and down-regulated DEGs are shown in green. (B) The heatmap of DEGs: up-regulated DEGs are shown in red and down-regulated DEGs are shown in green. . (For interpretation of the references to color in this figure legend, the reader is referred to the Web version of this article.) |

Fig. 3. GO bar chart with significant accumulation and dendrogram of BP terms. (A) GO bar chart with significant accumulation: Significantly enriched GO terms based on p ≤ 0.05, horizontal axis means logarithm of p value, vertical axis means the GO items, BP terms are shown in red, MF terms are shown in blue, CC terms are shown in green. (B) Dendrogram of BP terms: Each node represents a GO term, and the box represents the GO term of the top 10 in the order of the degree of significant accumulation. The depth of the color represents the degree of enrichment, and the darker the color, the higher the degree of enrichment. Each node displays GO ID and GO description. . (For interpretation of the references to color in this figure legend, the reader is referred to the Web version of this article.) |
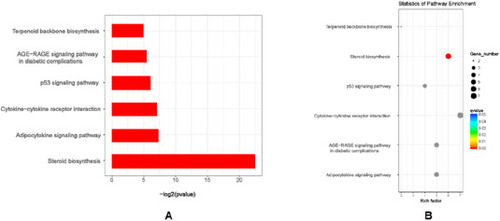
Fig. 4. KEGG enrichment significant bar chart and KEGG enrichment significant scatter. (A) KEGG enrichment significant bar: Significantly enriched KEGG pathways based on p ≤ 0.05, horizontal axis means logarithm of p value, vertical axis means the KEGG pathway items. (B) KEGG enrichment significant scatter: Each dot represents a KEGG pathway, the names of pathways are seen in vertical axis and enrichment factors are seen in horizontal axis. The larger the enrichment factor, the more reliable the significant enrichment of the DEGs in this pathway. |

Fig. 5. The Protein-Protein Interactions Network. (A) The Protein-Protein Interactions Network of all the 408 DEGs, (B) The Protein-Protein Interactions Network of the top 50 DEGs. |
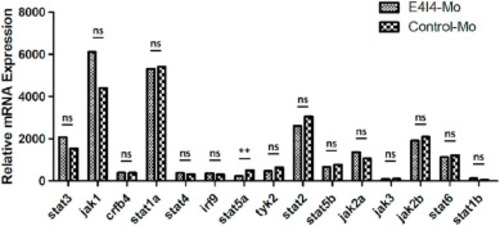
Fig. 6. Relative mRNA expression level comparison involved in JAK/STAT signaling pathway at 7dpf. |
Reprinted from Gene expression patterns : GEP, 43, Wang, W.Q., Qiu, S.W., Huang, S.S., Wang, G.J., Han, M.Y., Kang, D.Y., Yuan, Y.Y., Gao, X., Dai, P., Transcriptome analysis of the early stage ifnlr1-mutant zebrafish indicates the immune response to auditory dysfunction, 119229, Copyright (2021) with permission from Elsevier. Full text @ Gene Expr. Patterns