
|
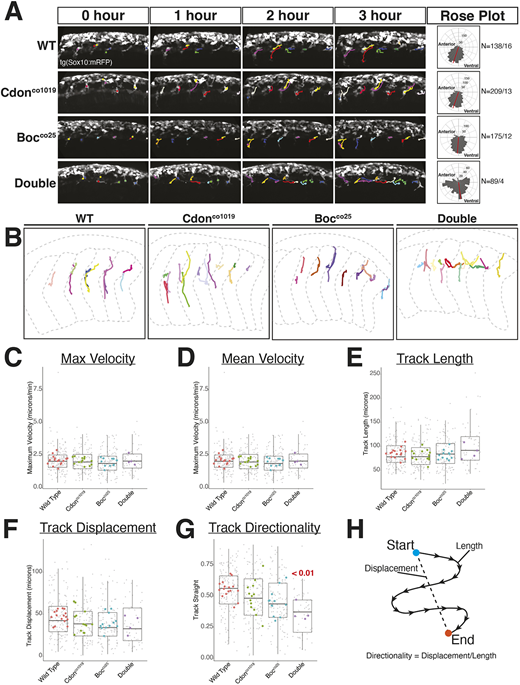
Fig. 5 NCC directionality, but not motility, is disrupted in cdon;boc mutants. (A) Maximum projection images show migrating tNCCs in representative wild-type, cdon, boc and double mutant embryos over a 6 h time period at the level of yolk extension. Colored lines are tracks of individual cells. There are horizontal tracks at body midline in double mutant embryos. Matched rose plots (right panels) show directional movement of NCCs in each genotype. Samples sizes reflect number of tracks/number of embryos. (B) Migration tracks overlaid onto outlines of somites (gray dashed lines) for representative embryos. Somite segments in the double mutant are wider and dysmorphic. (C-G) Quantification of NCC migration for maximum velocity (C), mean velocity (D), track length (E), track displacement (F) and track directionality (G). Small gray points are individual track values; large colored points are means for individuals; boxplots reflect variability across tracks. (H) Schematic of track straightness calculated as track displacement divided by track length. All images and data are taken at yolk extension. Horizontal line in box plot indicates the median. Lower and upper edges of boxes indicate the first and third quartiles, respectively. Whiskers indicate minimum and maximum values.