
Image
|
Figure Caption
Fig. 4
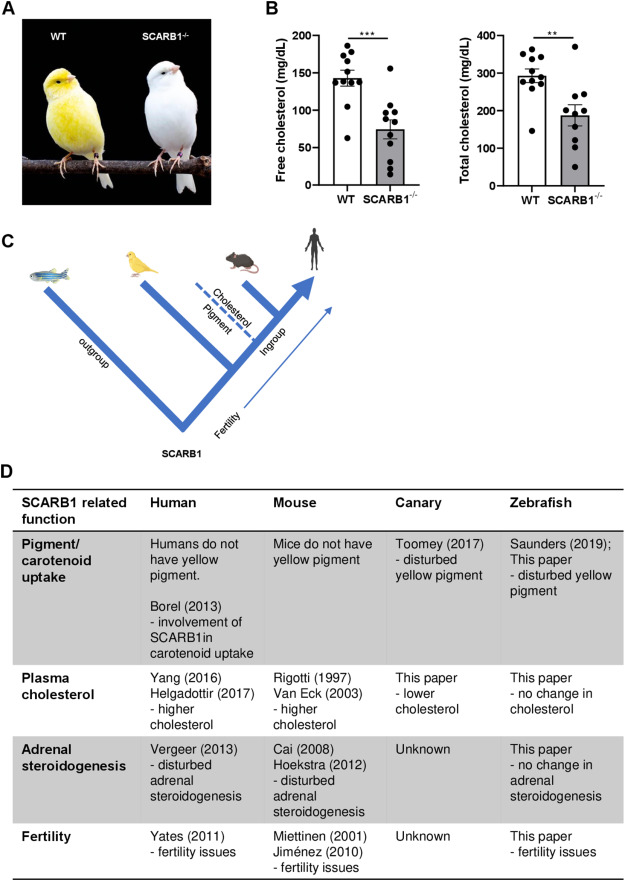
Fig. 4. Colour and cholesterol levels in SCARB1 mutant canaries (A) Representative pictures of WT and SCARB1 mutant canaries. (B) Free and total cholesterol levels of WT or SCARB1 mutant canaries (n = 12 per genotype) (C) Schematic overview of the suggested functions of SCARB1 and its evolution (D) Overview of known functions in SCARB1 mutant vertebrates. Means ± SEM. p < 0.01**; p < 0.001*** (Student's t-test).
Acknowledgments
This image is the copyrighted work of the attributed author or publisher, and
ZFIN has permission only to display this image to its users.
Additional permissions should be obtained from the applicable author or publisher of the image.
Reprinted from Biochimica et biophysica acta. Molecular and cell biology of lipids, 1868(6), Verwilligen, R.A.F., Mulder, L., Araújo, P.M., Carneiro, M., Bussmann, J., Hoekstra, M., Van Eck, M., Zebrafish as outgroup model to study evolution of scavenger receptor class B type I functions, 159308, Copyright (2023) with permission from Elsevier. Full text @ BBA Molecular and Cell Biology of Lipids