
|
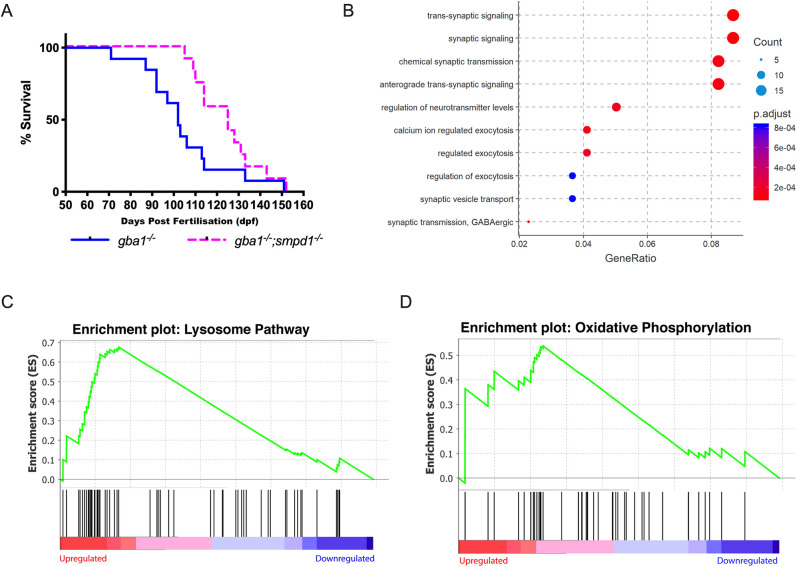
Fig. 5.
ASM deficiency improves survival and rescues neuronal dysfunction in gba1−/− zebrafish. (A) Disease-free survival analysis of gba1−/−;smpd1−/− double-mutant (n=13) compared to gba1−/− single-mutant (n=12) zebrafish. P=0.0055 by Gehan–Breslow–Wilcoxon test. Animals were culled for humane reasons when they could no longer consistently maintain buoyancy. (B) The Comparative GO analysis indicates marked global impairment of neuronal function in gba1−/− but restoration of neuronal health in gba1−/−;smpd1−/− . A differential expression analysis was first used to identify genes with statistically significant difference between gba1−/− and gba1−/−;smpd1−/−. Genes with adjusted P-value<0.05 and log2(fold change) >1 or <−1 were used to identify enriched biological processes amongst genes that were over- and under-expressed in gba1−/−. ClusterProfiler identified significantly enriched GO terms within the gene expression changes, which were plotted by GeneRatio (ratio of the differentially expressed genes with one particular GO term to the total number of differentially expressed genes). The lists of over- and under-expressed genes were analysed separately. Shown are the ten GO terms with highest gene ratios amongst under-expressed genes, all relating to key aspects of normal neuronal function and homeostasis. The pathways downregulated in gba1−/− compared to WT were normalised in the double mutants. Each GO term is coloured according to the adjusted P-value and ranked according to gene ratio. The size of the point is then scaled according to the number of differentially expressed genes with the GO term. (C,D) Lysosomal pathway genes and oxidative phosphorylation pathway genes are upregulated in gba1−/− but normalised in gba1−/−;smpd1−/−. The comparison of RNAseq-based transcription levels in the respective pathways between gba1−/− and gba1−/−;smpd1−/− revealed that both lysosomal pathway genes (C) and oxidative phosphorylation pathway genes (D) were enriched with marked upregulation of both pathways in gba1−/− compared to WT and gba1−/−;smpd1−/−. The x-axis ranks all differentially expressed genes based on the rank metric score from the most upregulated (left) to the most downregulated (right) for either pathway. The vertical black lines show the location of pathway genes in the entire ranked list from the gba1−/− expression changes, compared to WT and double mutants. The y-axis is the degree to which a set of pathway genes is overrepresented at the extremes (up- or downregulated) of the entire ranked list of all differentially expressed genes within the genome. A peak in enrichment score (green line) demonstrates an enrichment of pathway genes amongst all over- or under-represented genes. A sharp peak demonstrates how highly upregulated each pathway is within the gba1−/− group compared to WT and double mutants.