
|
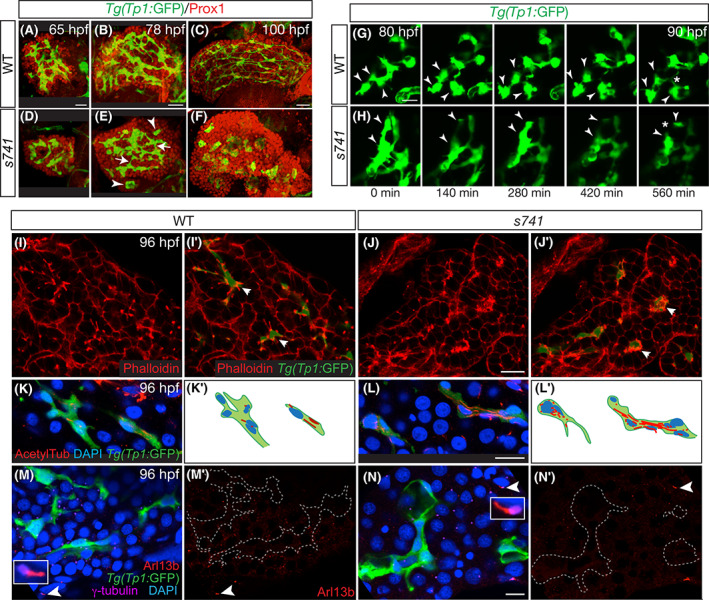
Fig. 5
Bile duct morphogenesis was impaired in s741 mutants. (A–F) Time‐course analysis of bile duct morphogenesis. Tg(Tp1:GFP) expression marks the intrahepatic biliary cells (green), and Prox1 antibody labels the nuclei of hepatocytes and biliary cells (red). In (E), arrows point to the interconnecting ducts between biliary cells. Arrowheads mark biliary cell clusters that did not connect to other biliary cells. Confocal 3D projections; ventral view; anterior is on the top. Eight WT and 8 mutants were collected at each time point, and all showed the representative phenotypes. (G,H) Snapshots of time‐lapse live imaging of Tg(Tp1:GFP)+ biliary cells in WT (n = 3) and s741 mutants (n = 3). Arrowheads point to the same groups of biliary cells over time. Asterisk in (G) shows the new interconnecting ducts formed by the three biliary cells marked by arrowheads. Asterisk in (H) shows the loss of the pre‐existing connecting duct between the two biliary cells marked by arrowheads. Confocal 3D projections; lateral view; anterior is on the left. (I,J) Larval livers stained with Phalloidin to label F‐actin. (I',J') The same samples as (I) and (J) with Tg(Tp1:GFP) expression marking the biliary cells (green). (K,L) Larval livers stained with acetylated‐tubulin/acetylTub antibody for stabilized microtubules (red), 4′,6‐diamidino‐2‐phenylindole (DAPI) for nucleus (blue), and Tg(Tp1:GFP) expression for biliary cells (green). (K',L') Schematic diagrams of the biliary cells shown in (K) and (L). Nuclei and acetylated‐tubulin staining are shown. (M,N) Larval livers stained with Arl13b antibody for primary cilia (red), γ‐tubulin for basal bodies (purple), DAPI for nucleus (blue), and Tg(Tp1:GFP) expression for biliary cells (green). (M',N') The same images as in (M) and (N) but with only Arl13b staining. The biliary cells, which are outlined by dashed lines, lacked obvious Arl13b staining, whereas the neighboring cells had distinct primary cilia marked by Arl13b (white arrowheads in [M]–[N']). Inserts in (M) and (N) show high magnification images of representative primary cilia marked by arrowheads. (I–N) Confocal single plane images. Vibratome sections. Ten WT and 10 mutants were examined and all showed the representative phenotypes. Scale bars: 30 μm (A–F); 20 μm (G–J'); and 10 μm (K–N').