
|
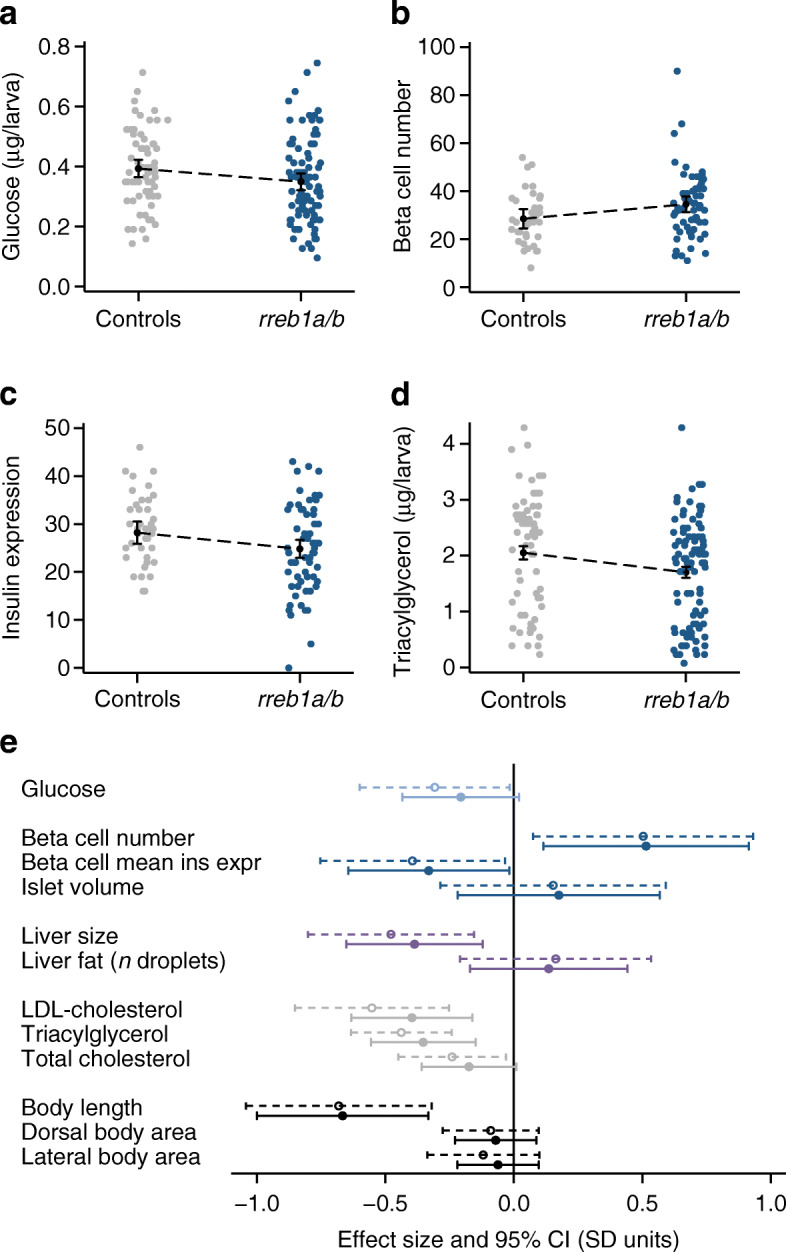
Fig. 2
Effect of CRISPR/Cas9-induced mutations in zebrafish rreb1a and rreb1b on diabetes-related traits. (a–d) Individual-level data and margin plots for effects of mutations in rreb1a/b and kita (vs sibling controls targeted only at kita) on key traits with significant differences between the two groups, analysed using multiple linear regression analysis (p<0.05): (a) glucose levels, (b) beta cell number, (c) beta cell mean insulin expression (arbitrary units) and (d) triacylglycerol levels. Effects were adjusted for experiment, tank and time of day. Effects on glucose and triacylglycerol levels were additionally adjusted for imaging (yes/no) and for sample position and run. (e) Forest plot showing effect sizes and 95% CIs from multiple linear regression analysis for 10-day-old CRISPR/Cas9 founders with mutations in rreb1a/b and kita vs controls targeted only at kita. Dashed 95% CIs reflect results for crispants vs sibling controls only; solid 95% CIs show results including 536 additional controls from other experiments performed the same way. Adjustments are as described for Fig. 2a–d. Dorsal and lateral body area were additionally adjusted for length