
Image
|
Figure Caption
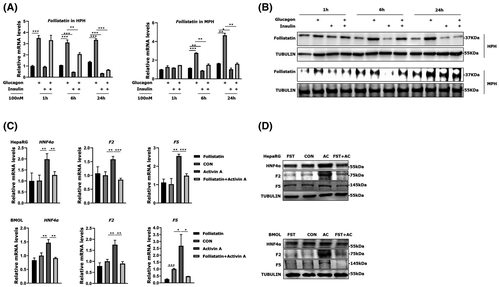
Fig. 7
Insulin-regulated and glucagon-regulated FST determines the activin-HNF4α-coagulation factor axis in LPCs. (A,B) Quantitative PCR and western blot were used to measure mRNA and protein expression of FST in human primary hepatocytes (HPHs) and mouse primary hepatocytes (MPHs) with insulin and/or glucagon treatment. (C,D) Quantitative PCR and western blot were used to measure mRNA and protein expression of HNF4α and F5 in HepaRG and BMOL cells with activin and/or FSTs treatment for 24 h. Tubulin was used as loading control in western blotting. *p < 0.05, **p < 0.01, and ***p < 0.001
Acknowledgments
This image is the copyrighted work of the attributed author or publisher, and
ZFIN has permission only to display this image to its users.
Additional permissions should be obtained from the applicable author or publisher of the image.
Full text @ Hepatology