
Image
|
Figure Caption
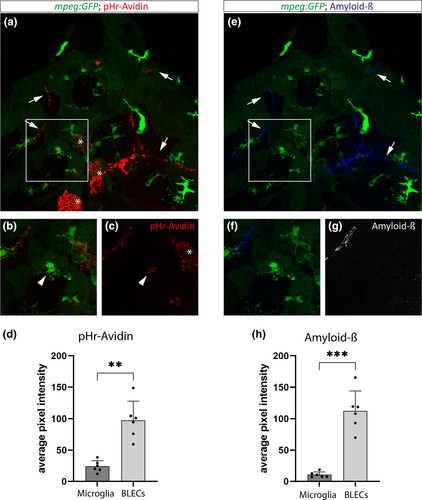
Fig. 3
Microglia take up Avidin and Amyloid-β less efficiently than BLECs. (a-c) Maximum projections of a 5dpf mpeg:GFP positive embryo in which pHr-Avidin was injected into the optic tectum. Note the auto-fluorescence in the red channel, marked by asterisks. (d) The average pixel intensity of the pHr-Avidin signal is significantly lower in microglia compared to BLECs (Welch's t-test, p = .0014). (e-g) Maximum projections of the same embryo, showing the distribution of HiLyte Fluor 647-labeled Amyloid-β (1–40) protein after parenchymal administration. (b, c and f, g) Zoom-in of the indicated regions in (a) and (e), respectively. Arrows highlight an uptake event in BLECs, arrowheads indicate an uptake by a mpeg + macrophage. (h) Quantification of the average pixel intensity of Amyloid-β accumulating in microglia and BLECs results in significantly higher values for BLECs as compared to microglia (Welch's t-test, p = .0005). Number of embryos analyzed was n = 4. Values are presented as means ± SD
Figure Data
Acknowledgments
This image is the copyrighted work of the attributed author or publisher, and
ZFIN has permission only to display this image to its users.
Additional permissions should be obtained from the applicable author or publisher of the image.
Full text @ Glia