
|
Fig. 3.
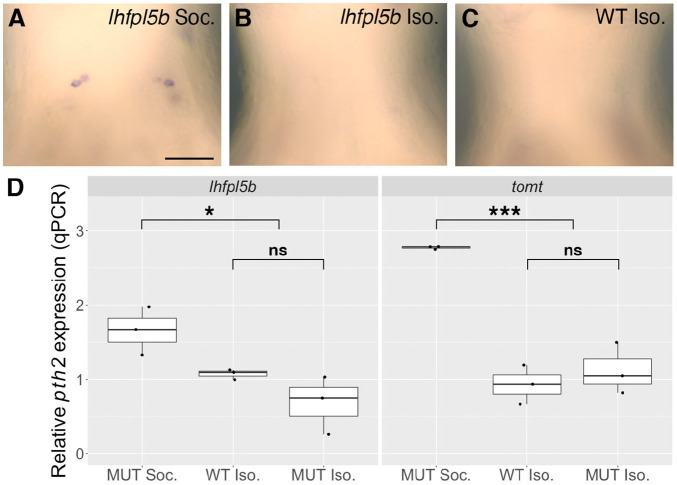
Social isolation further reduces pth2 expression in sensory-hair-cell mutants. (A-C) mRNA ISH showing representative examples of pth2-positive cells in 4 dpf (A) socially-reared lhfpl5bvo35 mutants (n=48), (B) isolated WT larvae (n=50), and (C) isolated lhfpl5bvo35 mutants (n=40). Scale bar: 50 µm, applies to all images. (D) Boxplots of qPCR results comparing pth2 expression in socially reared lhfpl5bvo35 and tomttk256c mutants relative to isolated mutant and WT siblings at 4 dpf. Ten larval heads were pooled per condition to make one biological replicate, and three biological replicates were used to generate the data. Two technical replicates of the qPCR experiment were conducted per biological replicate and averaged. Two-way ANOVA with Tukey post-hoc test to assess significance, ***P<0.001, *P<0.05; ns, not significant.