
|
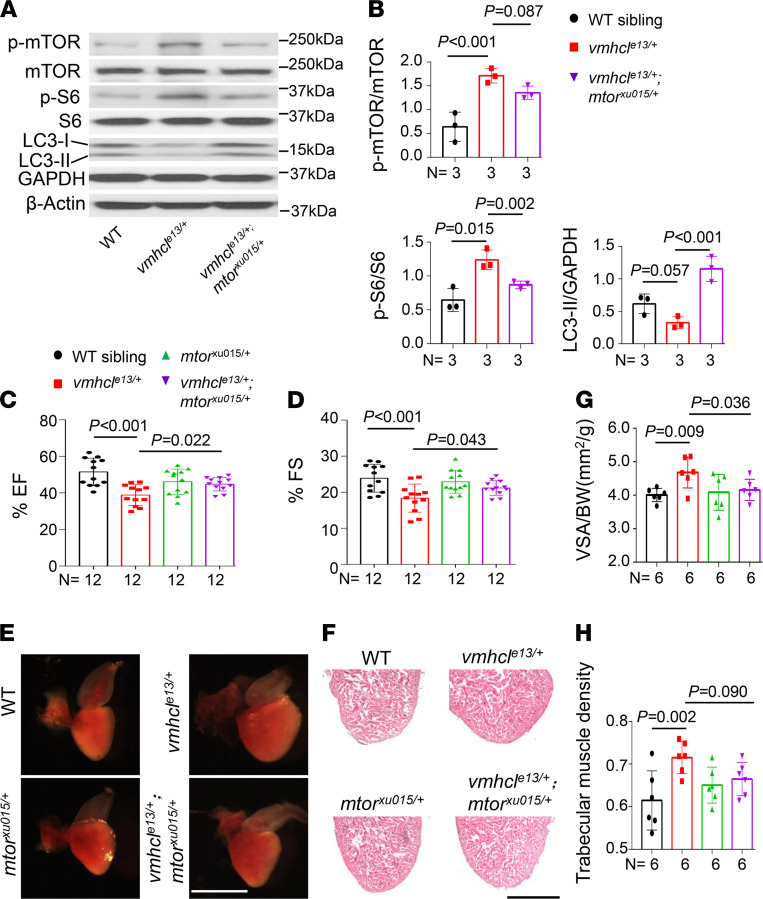
Figure 6
(A and B) Representative Western blots showing the levels of proteins involved in mTOR signaling pathways in WT controls, vmhcle13/+, and vmhcle13/+mtorxu015/+ mutants and quantification analysis. n = 3 biological replicates; data are presented as the mean ± SD; 1-way ANOVA. (C and D) Quantification of the percent EF and FS using echocardiography in fish at 8 months. n = 12; data are presented as the mean ± SD; 1-way ANOVA. (E and F) Representative images of isolated hearts and H&E staining in the apex area in fish at 8 months. (G and H) Quantification of the VSA normalized to BW and trabecular muscle density in these mutants and WT controls at 8 months. n = 6; data are presented as the mean ± SD; 1-way ANOVA. Scale bars: 2 mm in E and 300 μm in F.