
|
Figure 5
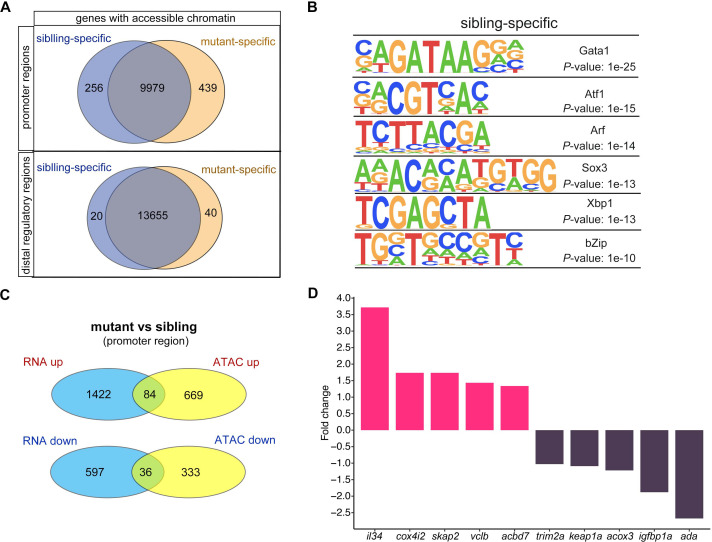
(A) Venn plot showing the genes of sibling and mutant specific accessible chromatin regions at promoter and distal regulator regions, respectively. (B) Motifs enriched in nucleosome-free regions (NFRs) with lost accessibility after smarca5 deletion. (C) Venn plot showing the overlap of genes with specific accessible chromatin at promoter regions and upregulated expression in mutant (top) and sibling (bottom) RBCs, respectively. Genes for ATAC-seq were assigned by differential accessible regions. (D) Bar plot showing the selected sibling and mutant-specific differential expression genes. Fold change, log2 fold change.
Changes in chromatin accessibility in RBCs from smarca5zko1049a and their siblings.