
|
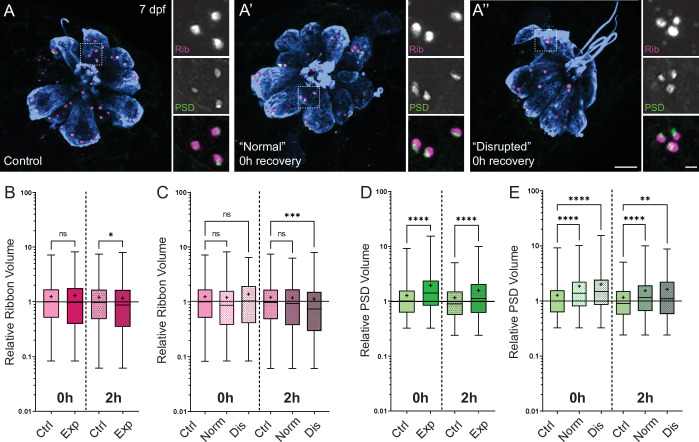
Figure 8.
(A-A’’) Representative images of control (A) and exposed (A’, A”) neuromasts. Synaptic ribbons (magenta; Ribeye b), PSDs (green; MAGUK), and hair cells (blue, Parvalbumin) were immunolabeled. Scale bars: 5 µm (main panels), 1 µm (insets). (B–E) Box and whisker plots of relative synapse volumes normalized to 0 hr control. Whiskers indicate the min. and max. values; ‘+’ indicates the mean value, horizontal lines indicate the relative median value of the control. (B) Ribbon volume appeared comparable to control immediately following exposure but was reduced 2 hr after exposure (*p = 0.0195). (C) Significant reduction in ribbon size relative to control was specific to disrupted neuromasts (Kruskal-Wallis test: ***p = 0.0004 (2h)). (D) Significantly larger PSDs were observed both immediately and 2 hr following exposure (****p < 0.0001). (E) Enlarged PSDs were present in both ‘normal’ and ‘disrupted’ exposed neuromasts, with a greater enlargement observed 0 hr post-exposure (Kruskal-Wallis test: ****p < 0.0001 (0h); ***p = 0.0001, **p = 0.0024 (2h)).
Changes in synaptic ribbon and PSD sizes following sustained mechanical overstimulation.