
|
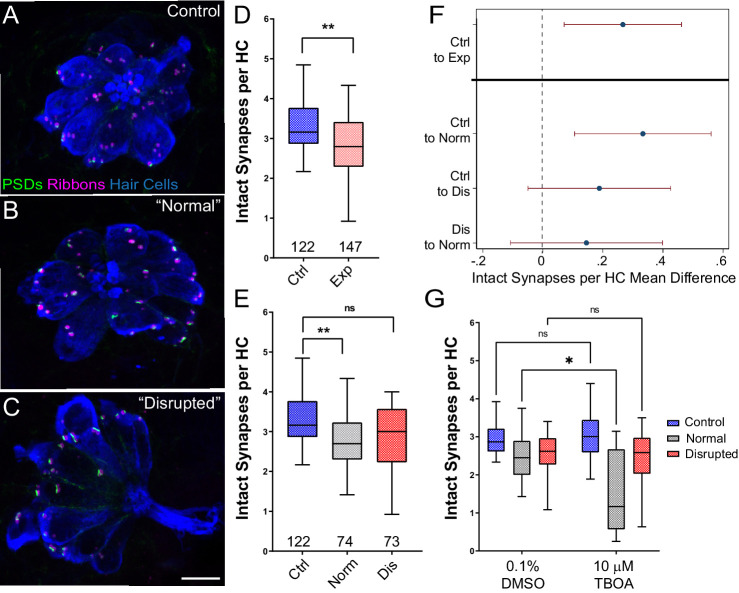
Figure 4
(A–C) Representative maximum intensity projection images of unexposed (A), or stimulus exposed lateral-line neuromast with ‘normal’ (B) or ‘disrupted’ (C) morphology. Synaptic ribbons (magenta; Ribeye b), PSDs (green; MAGUK) and hair cells (blue; Parvalbumin) were immunolabled. Scale bar: 5 µm (D–E) Intact synapses per neuromast hair cell. Pink box plot in D (Exp) represents pooled exposed neuromasts while, in E, gray (Norm) and red (Dis) plots represent neuromasts parsed into normal and disrupted groups. Whiskers = min to max. The average number of intact synapses per hair cell was significantly reduced in exposed neuromasts (D; **Adj p = 0.0078); when parsed, this reduction was significant in the ‘normal’ exposure group relative to control (E; **Adj p = 0.0043 normal, Adj p = 0.1207 disrupted). (F) Differences of least squares means in number of intact synapses per hair cell between groups. Bars represent 95% CI. (G) The number of intact synapses per hair cell in larvae co-treated with TBOA, to block glutamate clearance, or drug carrier alone during exposure. Synapse loss was significantly greater in ‘normal’ neuromasts co-exposed to TBOA compared to fish co-exposed to the drug carrier alone (Two-way ANOVA. *p < 0.0187).
Significant hair-cell synapse loss is observed in ‘normal’ neuromasts following mechanical overstimulation and exacerbated by blocking glutamate uptake.