IMAGE

FIGURE 8

ID
ZDB-IMAGE-210718-40
Genes
Source
Figures for Hsiao et al., 2021
Image
Figure Caption

FIGURE 8

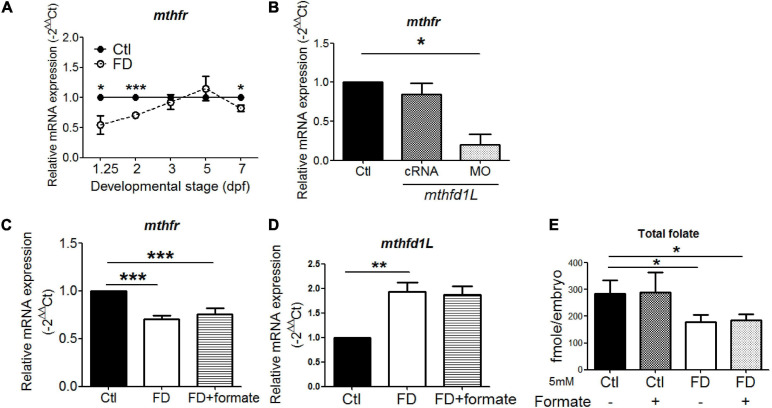
The interplay between Mthfr and Mthfd1L. (A) FD larvae collected at the indicated stages were examined for the developmental timing-specific expression of mthfr during embryogenesis. (B) Wild-type embryos injected with mthfd1L cRNA or MO were examined for the expression of mthfr at 1 dpf. (C) FD embryos with/without formate supplementation were examined for mthfr mRNA levels at 2 dpf. (D) FD embryos with/without formate supplementation were examined for mthfd1L mRNA levels at 5 dpf. (E) Control and FD embryos supplemented with or without 5 mM formate were measured for their total folate content at 2 dpf. ***p-value < 0.001; **p-value < 0.01; *p-value < 0.05.

Figure Data
Acknowledgments
This image is the copyrighted work of the attributed author or publisher, and ZFIN has permission only to display this image to its users. Additional permissions should be obtained from the applicable author or publisher of the image. Full text @ Front Cell Dev Biol