
Image
|
Figure Caption
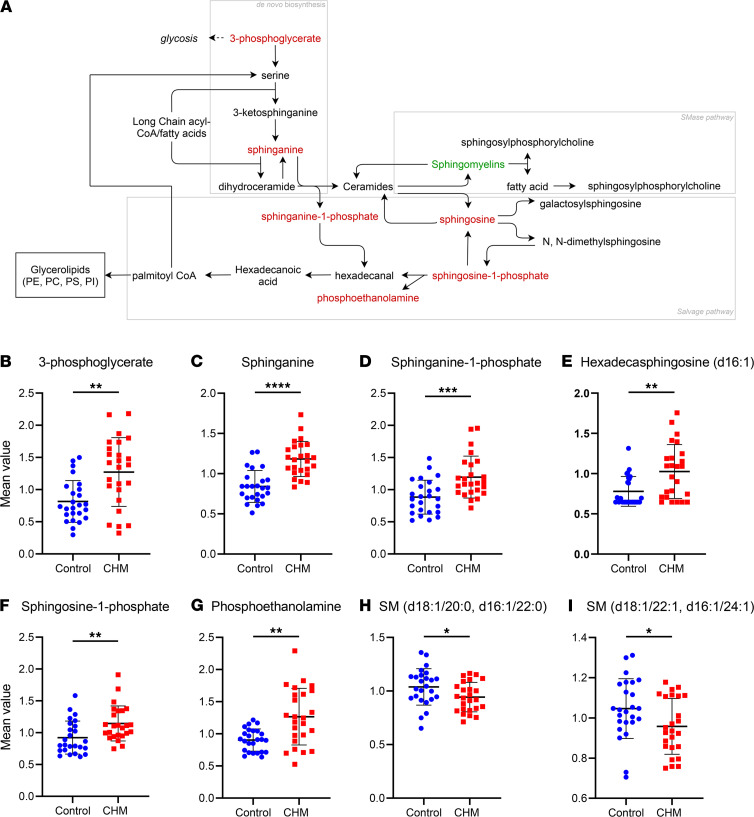
Figure 4 Disturbance of sphingolipid metabolism in CHM patients. (A) General sphingolipid metabolism pathway with compounds differentially detected in CHM patients highlighted in red (increased) or green (decreased) compared with control levels. (B–I) Scatter dot plots of key metabolite levels in both control (blue) and choroideremia (red) plasma samples. Lines indicate mean ± SD (n = 25). P value was determined using matched pair t tests. *P ≤ 0.05, **P ≤ 0.01, ***P ≤ 0.001, ****P ≤ 0.0001. SM, sphingomyelin.
Acknowledgments
This image is the copyrighted work of the attributed author or publisher, and
ZFIN has permission only to display this image to its users.
Additional permissions should be obtained from the applicable author or publisher of the image.
Full text @ JCI Insight