
Image
|
Figure Caption
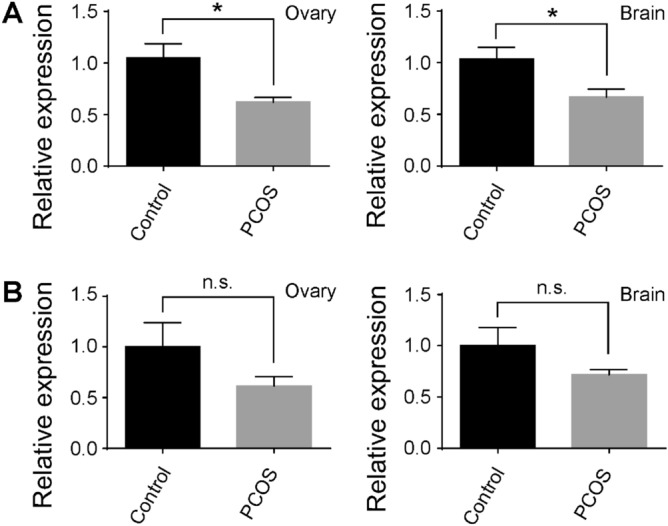
Figure 3 The expression of Tox3 (A) and Dennd1a (B) in isolated ovary and brain tissues from the control (black bars) and PCOS (grey bars) animals. The expression of Tox3 and Dennd1a in the control sample was normalized to 1, and their expression in PCOS fish was compared to the base value of 1. Note the decrease of Tox3 expression in PCOS samples. However, no significant changes in Dennd1a expression were detected. Data represents the means ± SE (n = 8 in each group). *p < 0.05; ns not significant.
Figure Data
Acknowledgments
This image is the copyrighted work of the attributed author or publisher, and
ZFIN has permission only to display this image to its users.
Additional permissions should be obtained from the applicable author or publisher of the image.
Full text @ Sci. Rep.