
|
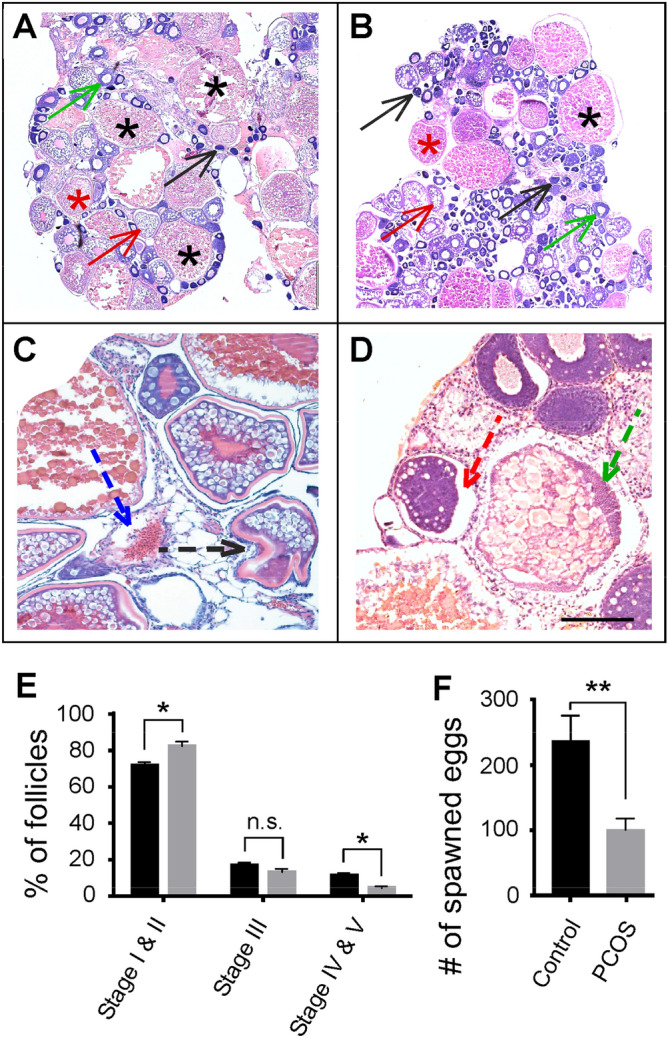
Figure 2 Follicle development and ovulation in control and PCOS zebrafish. (A,B) Histological sections of the ovary. In control fish (A), follicles at different stages could be identified. These include developing follicles (Stages I and II, black and green arrows), transitioning follicles (Stage III, red arrows), and mature follicles (Stages IV and V, red and black asterisks). In PCOS fish (B), more developing follicles but less mature follicles were observed. (C,D) Histological sections that show abnormal follicles in PCOS fish. These include zona pellucida invagination (black arrow), theca hypertrophy/granulosa cell invagination (blue arrow), basal membrane disintegration (red arrow), and basophilic granular accumulation (green arrow). Scale bar: 100 µm in panels (A) and (B), and 50 µm in panels (C) and (D). (E) Percentage of developing, transitioning, and mature follicles in control (black bars) and PCOS fish (grey bars). Note the increase of developing follicles and the decrease of mature follicles in PCOS animals. (F) Ovulation in control (black bar) and PCOS (grey bar) zebrafish. Note the decrease of ovulation in PCOS fish. Data represents the means ± SE (n = 8 in each group). *p < 0.05; **p < 0.01; ns not significant.