
Image
|
Figure Caption
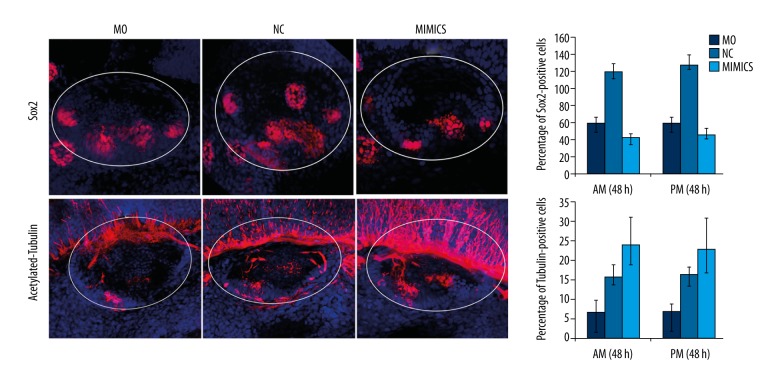
Fig. 5
MiR-194 promoted the differentiation of the sensory patches in zebrafish inner ear. The percentage of Sox2 (upper portion) and acetylated-tubulin (lower portion) positive cells were measured by in situ hybridization at 48 hpf. The white circle area indicated zebrafish inner ear. Red staining indicated Sox2 expression (upper portion) or acetylated-tubulin expression (lower portion); blue indicated cell nucleus. MO – microinjection with morpholino oligonucleotide; NC – negative control; Mimics – microinjection with miR-194 mimics; hpf – hour post fertilization.
Figure Data
Acknowledgments
This image is the copyrighted work of the attributed author or publisher, and
ZFIN has permission only to display this image to its users.
Additional permissions should be obtained from the applicable author or publisher of the image.
Full text @ Med. Sci. Monit.