
Image
|
Figure Caption
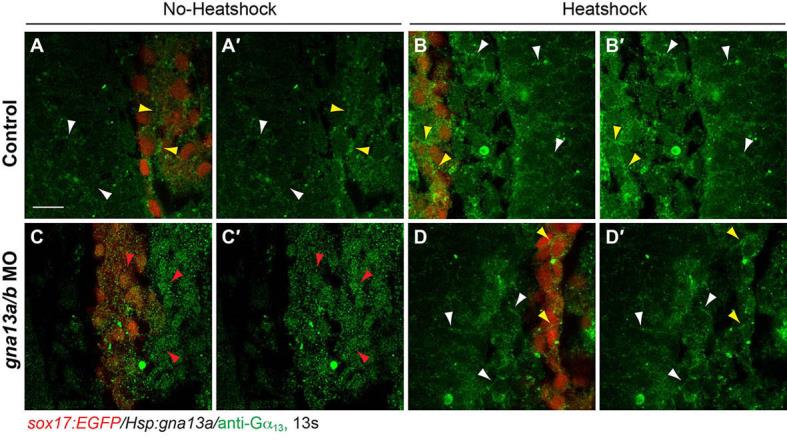
Fig. S5
Gα13 expression in Tg(hsp:gna13a) embryos. Single confocal Z-planes of the anterior region of embryos obtained from crossing Tg(sox17:EGFP) with Tg(hsp:gna13a), showing Gα13 expression in non-endodermal cells (white arrowheads) and endodermal cells (yellow arrowheads, false red colored) in indicated embryos that were heat-shocked at 37°C for 30 minutes or left untreated in the tail-bud stage. showing Gα13 expression disappeared in gna13a/b MO-injected embryos without heat-shock (red arrowheads). Scale bar: 20 μm.
Acknowledgments
This image is the copyrighted work of the attributed author or publisher, and
ZFIN has permission only to display this image to its users.
Additional permissions should be obtained from the applicable author or publisher of the image.
Full text @ Development