
Image
|
Figure Caption
Fig. S1
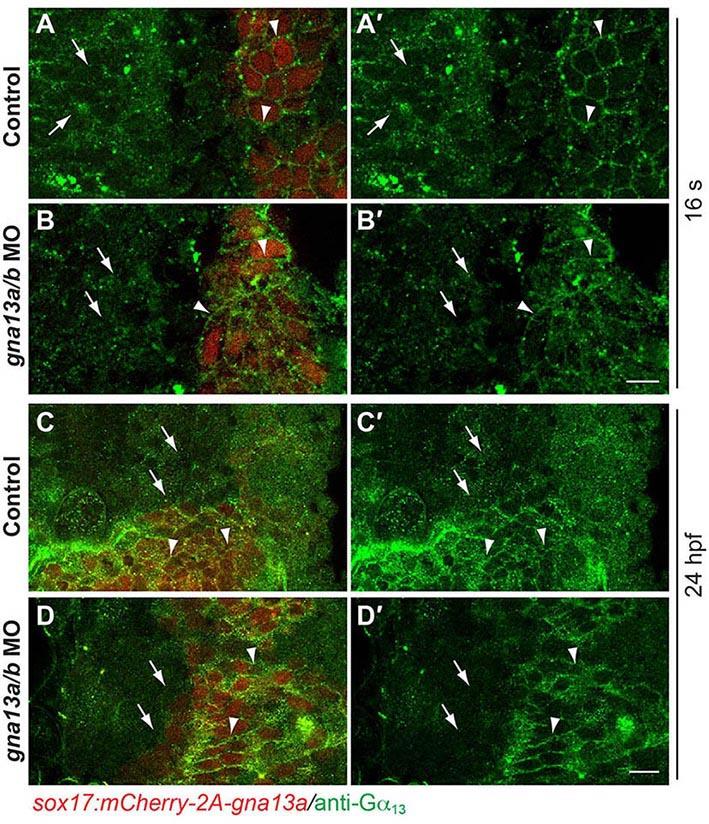
Transgenic Gα13 expression in the endoderm is resistant to injection of gna13a/b MO. Single confocal Z-planes of the anterior region of embryos in control and gna13a/b MO-injected Tg(sox17:mcherry-2A-gna13a) embryos at 16s and 24 hpf, showing Gα13 expression (green). Arrowheads: endodermal cells (red); arrows: non-endodermal cells. Scale bar: 20 μm.
Acknowledgments
This image is the copyrighted work of the attributed author or publisher, and
ZFIN has permission only to display this image to its users.
Additional permissions should be obtained from the applicable author or publisher of the image.
Full text @ Development