
|
Fig. S1
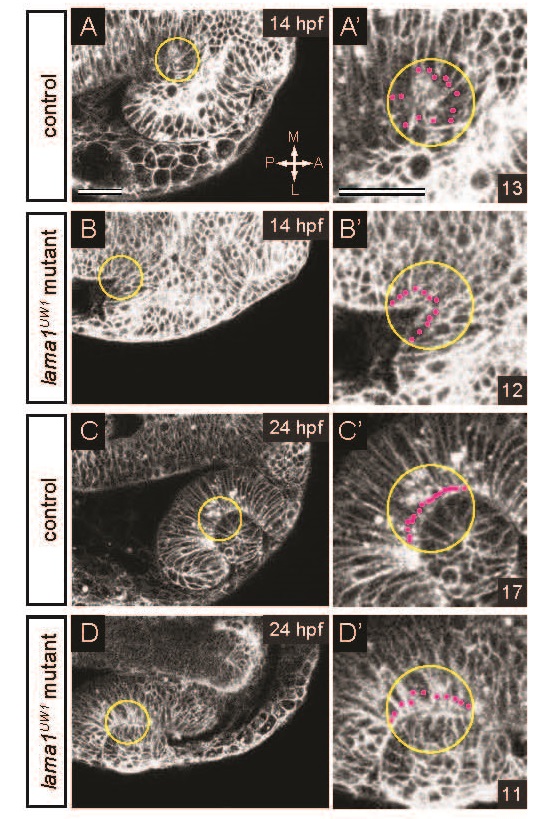
Method for measuring basal endfoot width. (A-B′) At 14 hpf, a 25 µm radius circle (yellow) was centered at the vertex of the optic stalk furrow. (C-D′) At 24 hpf, a 25 µm circle (yellow) was centered at the deepest point of the lens-retina interface. In all cases, basal surface length was measured using ImageJ. Within the circle, the number of cells in contact with the basal surface was counted (magenta dots). Average basal endfoot width was calculated by dividing the basal surface length by the number of cells in contact with it. (A-D) Single confocal sections for measurements. (A′-D′) Zoomed images. Numbers in bottom right insets are numbers of cells in contact with the basal surface in that image. Dorsal views; scale bar, 50 µm. A, anterior; P, posterior; M, medial; L, lateral.
Reprinted from Developmental Biology, 416(2), Bryan, C.D., Chien, C.B., Kwan, K.M., Loss of laminin alpha 1 results in multiple structural defects and divergent effects on adhesion during vertebrate optic cup morphogenesis, 324-37, Copyright (2016) with permission from Elsevier. Full text @ Dev. Biol.