
|
Fig. 5 S5
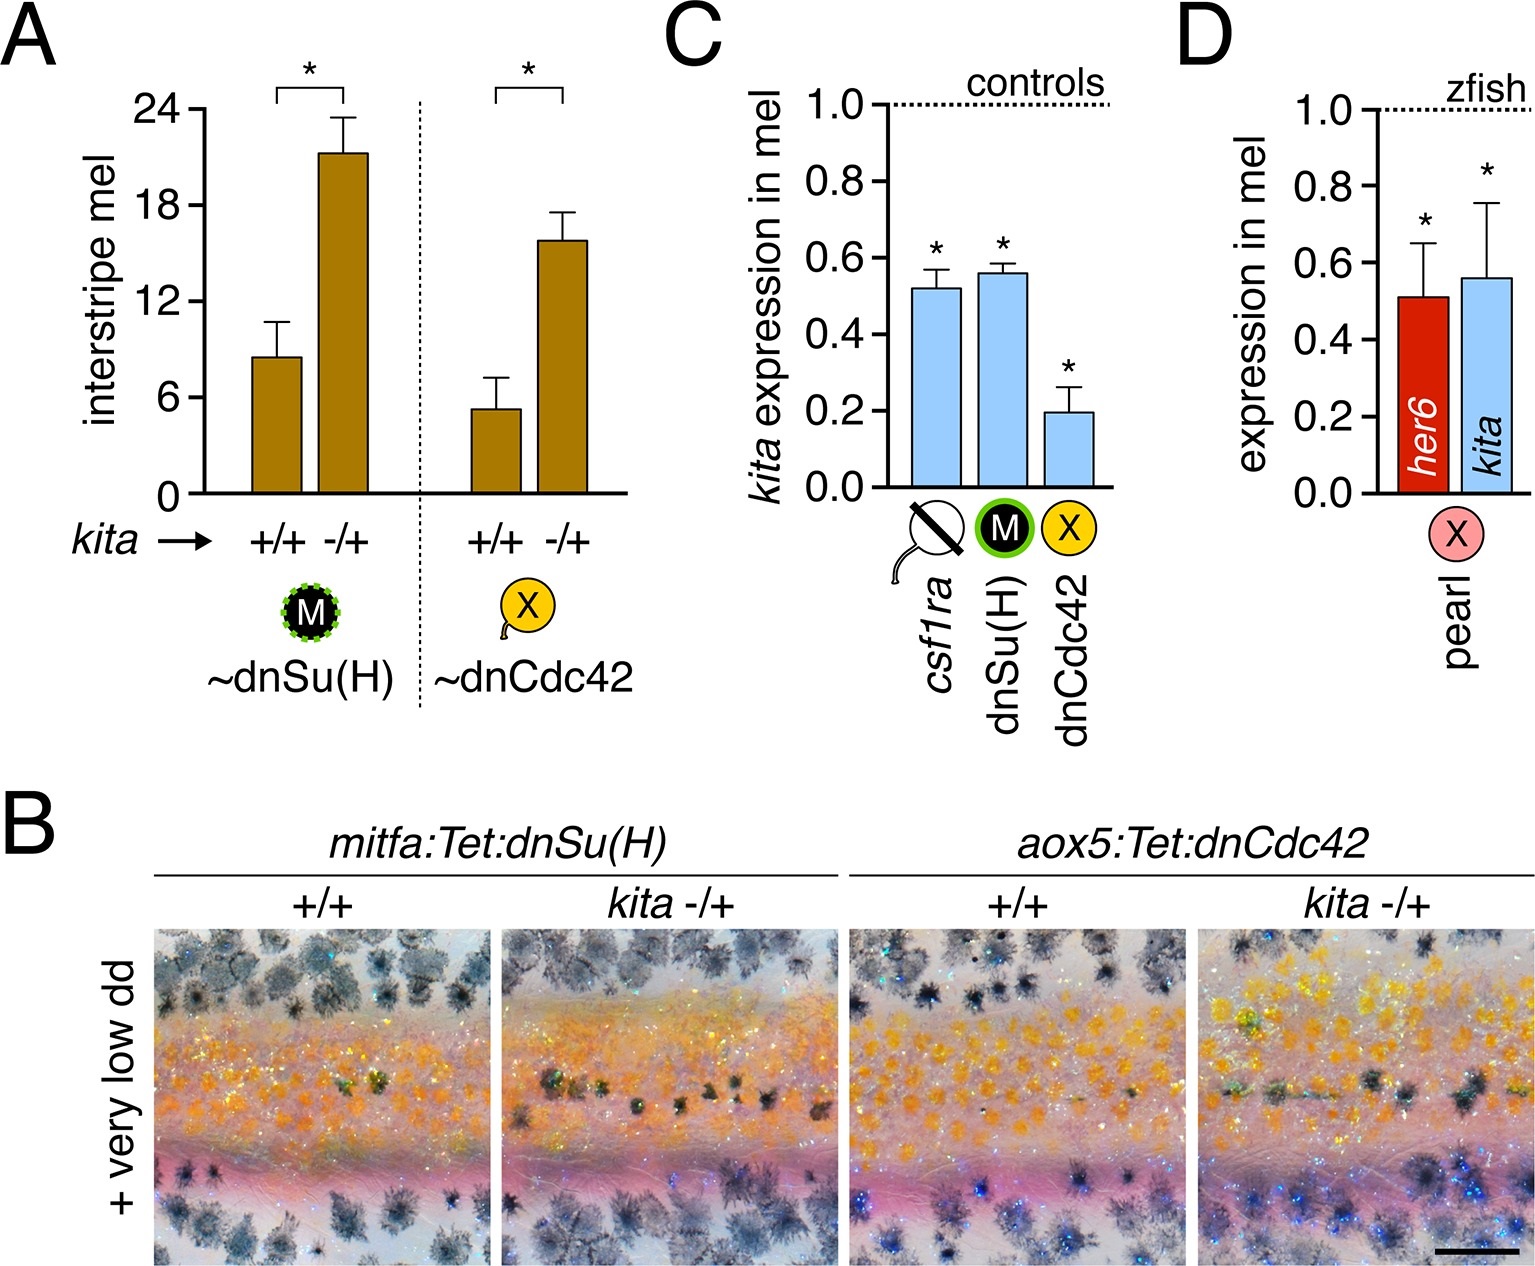
Dependence of melanophore kita expression on airinemes and Notch signaling.(A) kita heterozygosity sensitized melanophores (means ± SE) for reduced Notch signaling [dnSu(H); t7=4.0, p<0.005] or airineme production (dnCdc42; t6=4.0, p<0.005). (B) Excess interstripe melanophores in kita heterozygotes compared to fish homozygous wild type for kita when Notch signaling or airinemes are inhibited. (C) kita expression (means ± SE) was reduced upon depletion of xanthophore lineage, Notch signaling or airinemes (one-tailed, paired t2=9.9, 7.6, 5.0; all p<0.05). (D) In pearl melanophores, Notch signaling (her6; Figure 5—figure supplement 1C) and kita expression (means ± SE) were reduced in comparison to zebrafish melanophores (one-tailed, paired t2=3.4, 3.4; p<0.05). Scale: 200 µm (B).