
|
Fig. 4
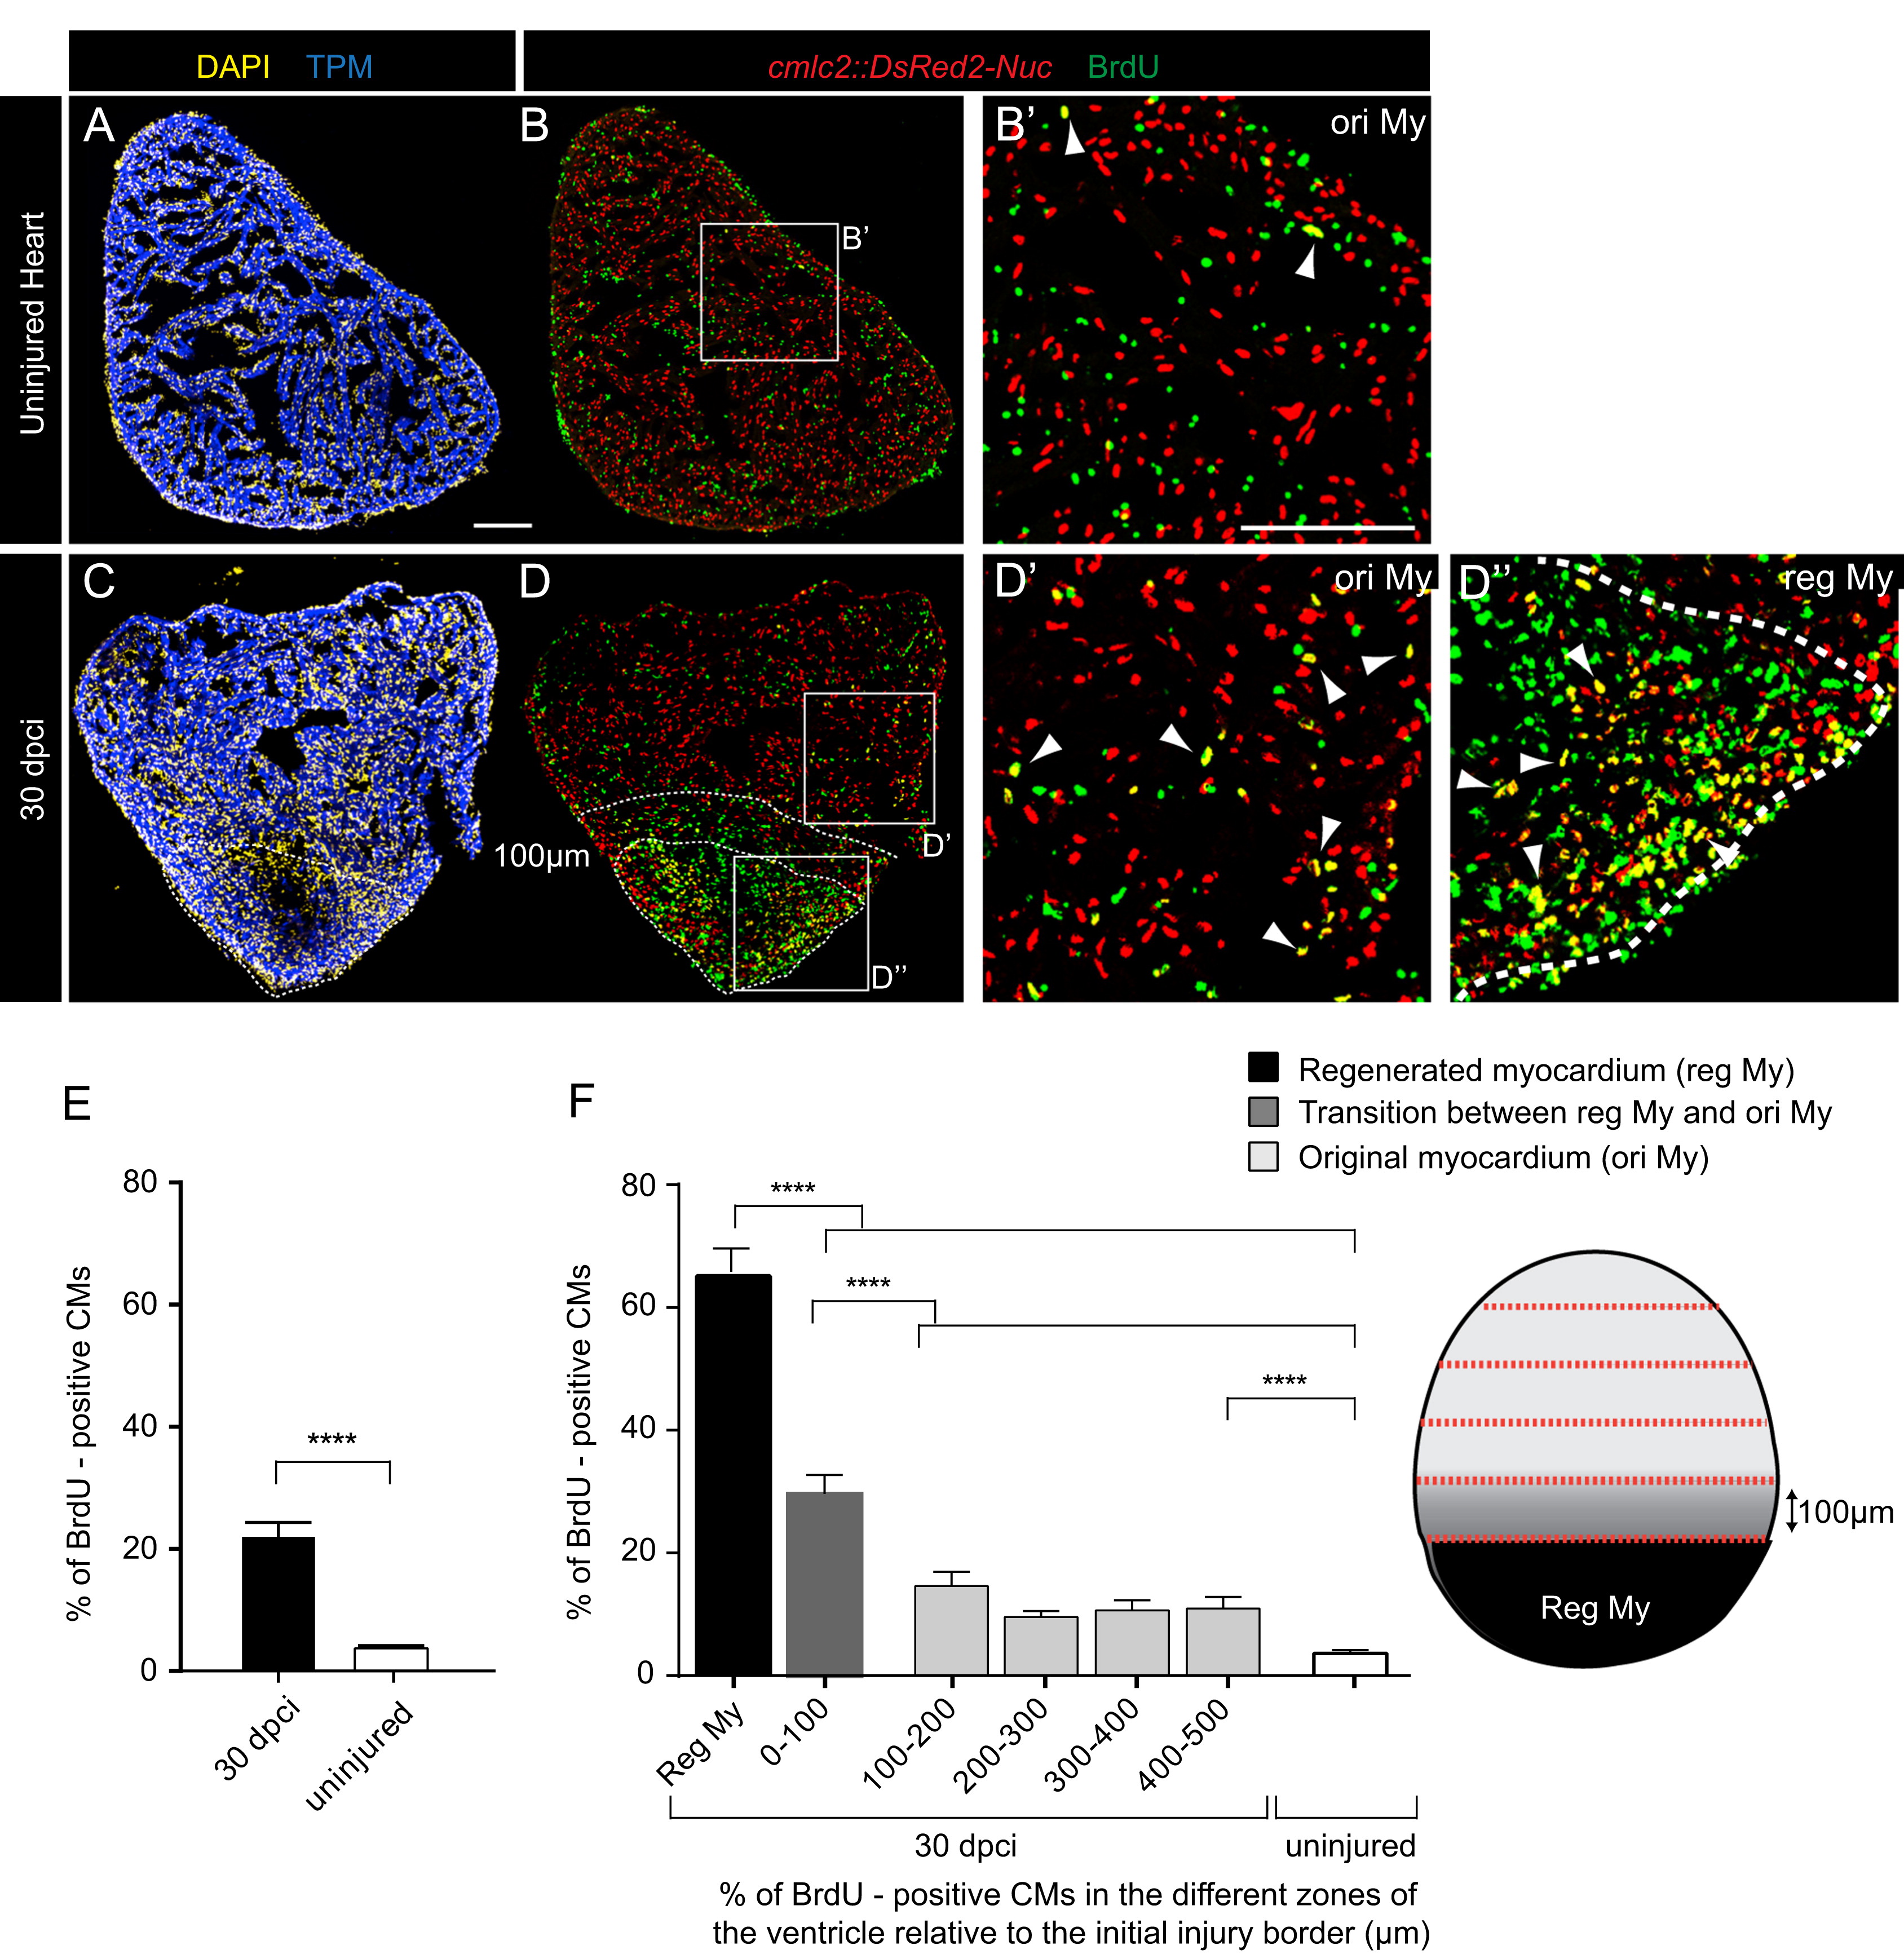
Spatial distribution of BrdU-labeled CMs after the completion of heart regeneration demonstrates the local and global patterns of the proliferative activity. (A–D) Heart sections of uninjured cmlc2::DsRed2-Nuc transgenic zebrafish treated with BrdU for 21 days (A, B) and at 30 dpci after BrdU treatment from day 7 to day 30 (C, D). The expression of cardiac marker Tropomyosin (TPM blue) and Ds-Red-Nuc reveals nearly complete regeneration of the myocardium at 30 dpci (C, D). CMs after DNA synthesis were identified in both groups by the colocalization of BrdU and dsRed signals (B′, D′, D′′, arrows). (D, D′, D′′) The border between the regenerated myocardium (reg My) and the original myocardium (ori My) can be identified by the difference in the BrdU incorporation (green). The region with abundant BrdU-labeling corresponds to the regenerated myocardium (encircled by a white dotted line). The most adjacent zone at 100 µm from this area is indicated with dashed line. Scale bar (A, Bó)=100 µm. (E) Quantification of BrdU-positive CMs in the entire regenerated heart at 30 dpci and in the uninjured control. (F) Quantification of BrdU-positive CMs in the reg My and in the 100 µm subregions of the ori My compared to uninjured heart. All results are expressed as the mean±standard error of the mean (S.E.M.) (ne5 hearts; 3–5 sections per heart; **** P-value<0.0001).
Reprinted from Developmental Biology, 399(1), Sallin, P., de Preux Charles, A., Duruz, V., Pfefferli, C., Jazwinska, A., A dual epimorphic and compensatory mode of heart regeneration in zebrafish, 27-40, Copyright (2015) with permission from Elsevier. Full text @ Dev. Biol.