
|
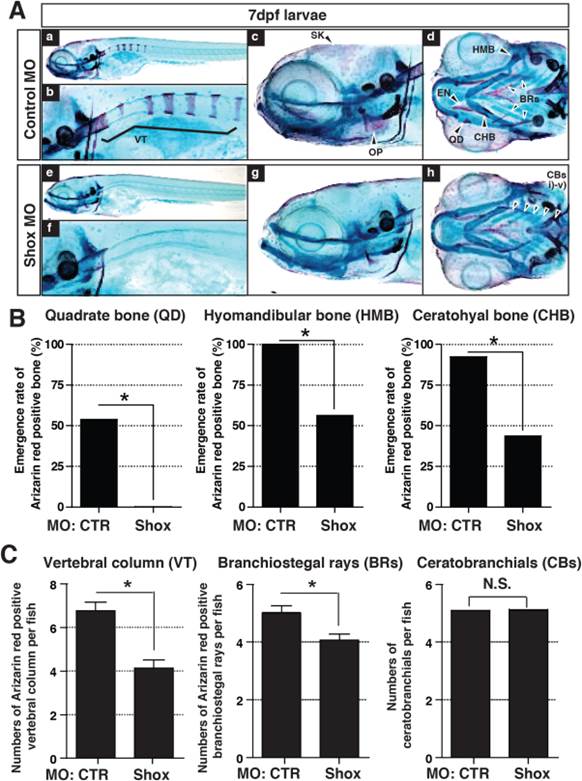
Fig. 5
The effects of early developmental loss of the shox gene expression on the calcification process in multiple craniofacial bones and vertebral columns. A: Results of the Alizarin red/Alcian blue staining in 7dpf larvae. a–d: Fish injected with control MO (8 ng/embryo). e–h: Fish injected with the same dose of the Shox MO at the 1–2-cell-stage embryos. a and e show whole body from lateral view, and b and f are magnified views of anterior vertebral columns. c, d, g, and h are magnified views of head region. c and g represent the lateral view, and d and h are the ventral view. VT, vertebral columns; SK, skull; OP, opercle; EN, entopterygoid; QD, quadrate; CHB, ceratohyal bone; BRs, branchiostegal rays; HMB, hyomandibular bone; CBs, ceratobranchials. B: Emergence rate of the Alizarin red positive bones (QD, CHB, and HMB) in 7bpf larvae. C: Cumulative numbers of Alizarin red positive VT and BRs (mineralized bone) and the numbers of CBs (cartilage) in the 10dpf larvae. Values are represented as mean±S.D. (n=13–16).