
|
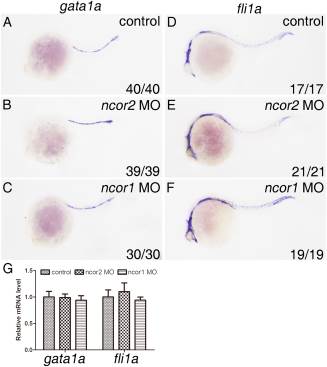
Fig. 2 Both zebrafish ncor2 and ncor1 morphants display normal development of primitive erythroid cells and endothelial cells at 24 hpf. Embryos at one- to two-cell stage were microinjected with control MO (A,D), ncor2 MO (B,E), and ncor1 MO (C,F), respectively. Whole-mount in situ hybridizations were performed on the microinjected embryos at 24 hpf to examine expressions of gata1a (A–C) and fli1a (D–F), respectively. All embryos were positioned anterior left and viewed laterally. G: Quantitative real-time PCR was performed to confirm changes of expression levels of gata1a and fli1a in ncor2 and ncor1 morphants. Experiments were repeated three times. Results were subjected to Student′s t-test.