
|
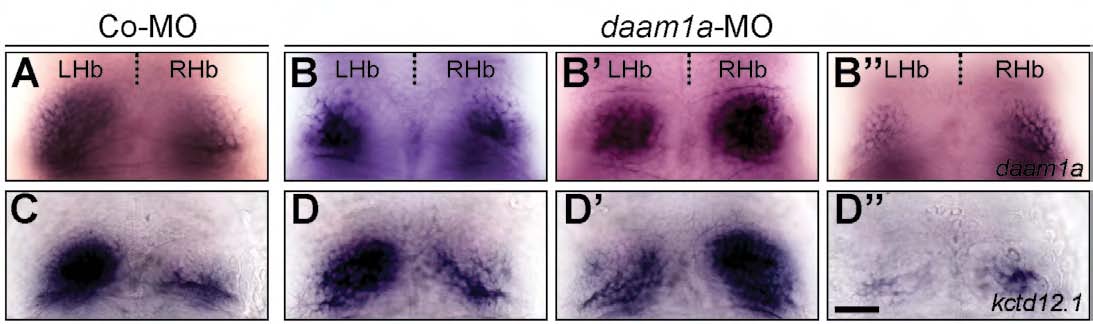
Fig. S2 Habenular expression of daam1a and kctd12.1 after Daam1a knock-down. (A,C) Expression of daam1a (A) and kcdt12.1 (C) in control embryos, revealing the enlarged asymmetric domain of the left Hb. (B-B′′) Global knock down of Daam1a results in equal proportions of asymmetric left-sided (B), asymmetric right-sided (B2), and bilateral-right symmetric (B′′) expression of daam1a. (D-D′′) Global knock down of Daam1a leads to equal proportions of asymmetric left-sided (D), asymmetric right-sided (D′), and bilateral-right symmetric (D′′) expression of kcdt12.1. The relative contributions of the different phenotypes are given in Table 2. Images correspond to dorsal views of the habenular region at 96 hpf, with anterior to the top. Scale bar, 20 μm.