
|
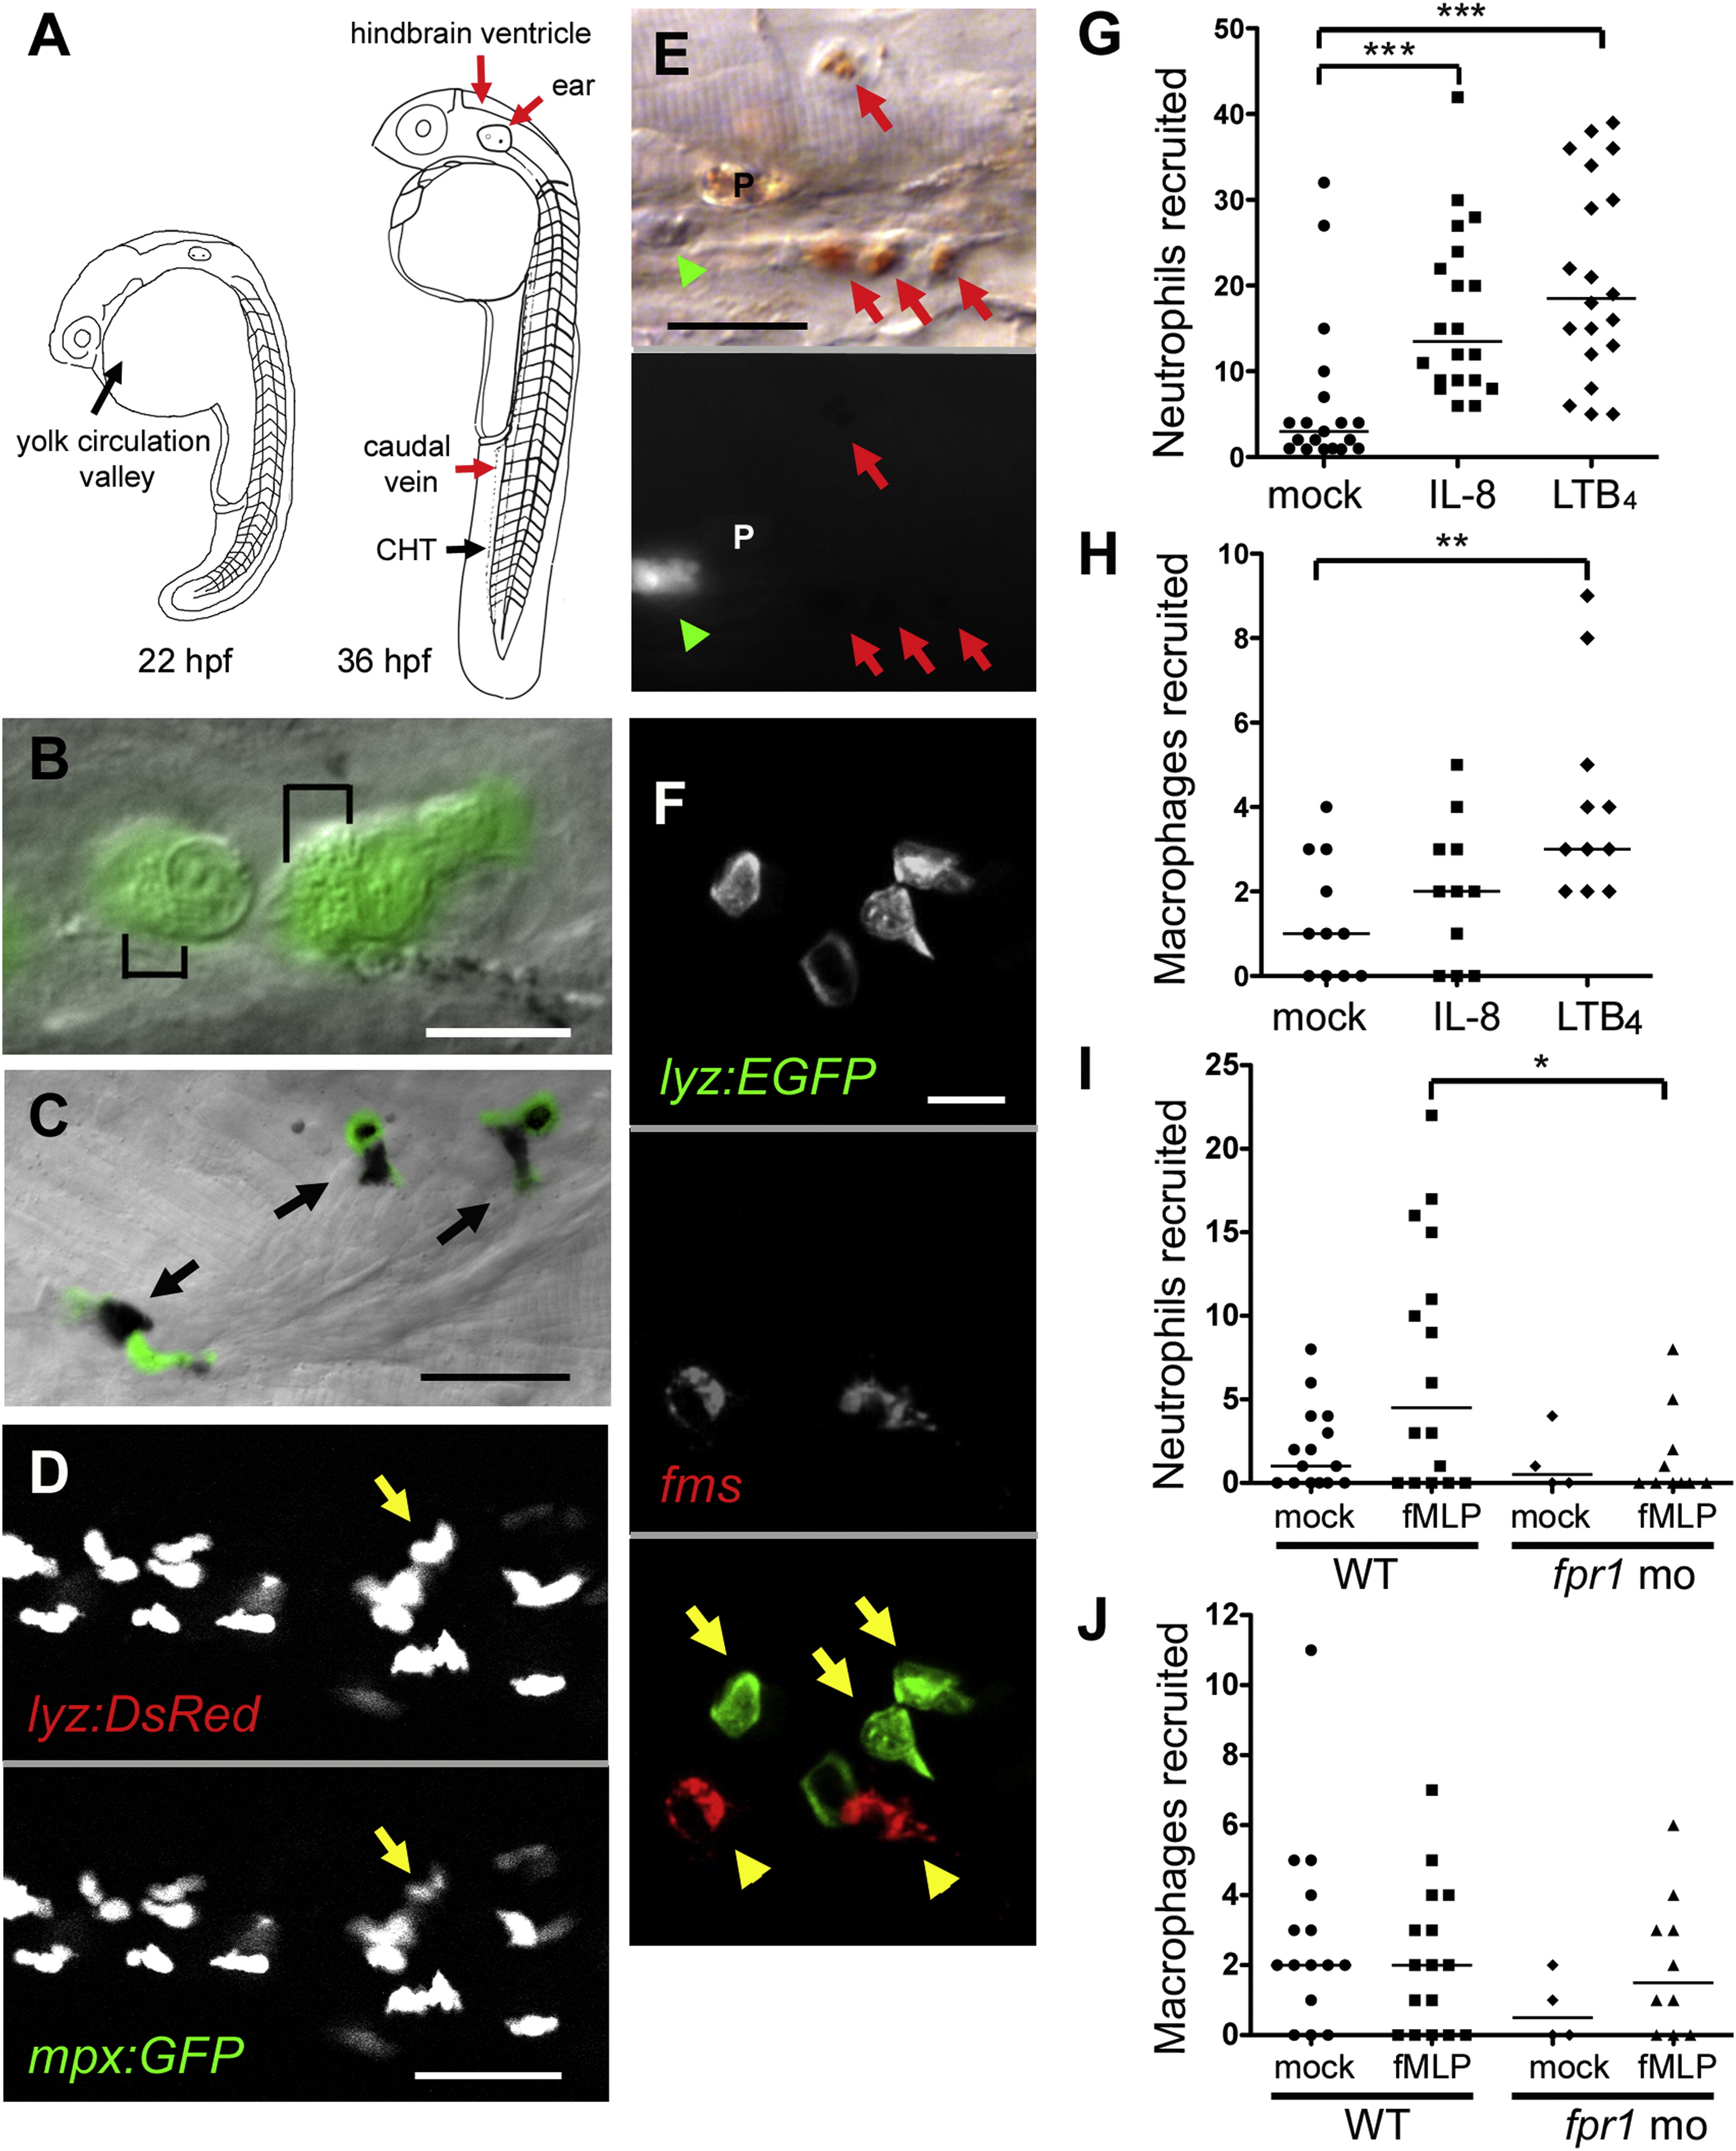
Fig. 1
Zebrafish Neutrophils Are Marked by GFP Expression in the lyz-Green Line and Are Functionally Similar to Mammalian Neutrophils (A) Cartoon of the zebrafish at two developmental stages showing sites of primitive and definitive hematopoiesis (black arrows) and injection sites used in this study (red arrows). CHT, caudal hematopoietic tissue. (B) GFP-positive cells in lyz-green fish showing well-defined granules (black brackets). Scale bar, 10 μm. (C) Colocalization of GFP-expressing cells (black arrows) with Sudan black. Scale bar, 20 μm. (D) Individual fluorescence channels of a single image of the lyz-red mpx:gfp double transgenic larvae. Arrow identifies a cell with differential expression of the two transgenes. Scale bar, 20 μm. (E) DIC (top) and GFP fluorescence channel (bottom) of a single image of a lyz-green larva stained with neutral red. Macrophages, red arrows; neutrophil, green arrowhead; pigment cell, P. Scale bar, 20 μm. (F) Whole-mount in situ hybridization analysis of 48 hpf lyz-green larva with fms probe (red fluorescence) combined with GFP antibody staining (green fluorescence). Macrophages, yellow arrowheads; neutrophils, yellow arrows. Scale bar, 10 μm. (G–J) Median phagocyte recruitment into the ear (G) or hindbrain ventricle (H–J) of 48 hpf larvae in response to injection of vehicle (mock), IL-8, LTB4, or fMLP. In (I) and (J), fpr1 mo refers to larvae with morpholino knockdown of the formyl peptide receptor 1. Results in (G)–(J) are representative of two experiments. Significance testing performed by Kruskal-Wallis test with Dunn′s posttest in (G)–(J). *p < 0.05; **p < 0.01; ***p < 0.0001.