
|
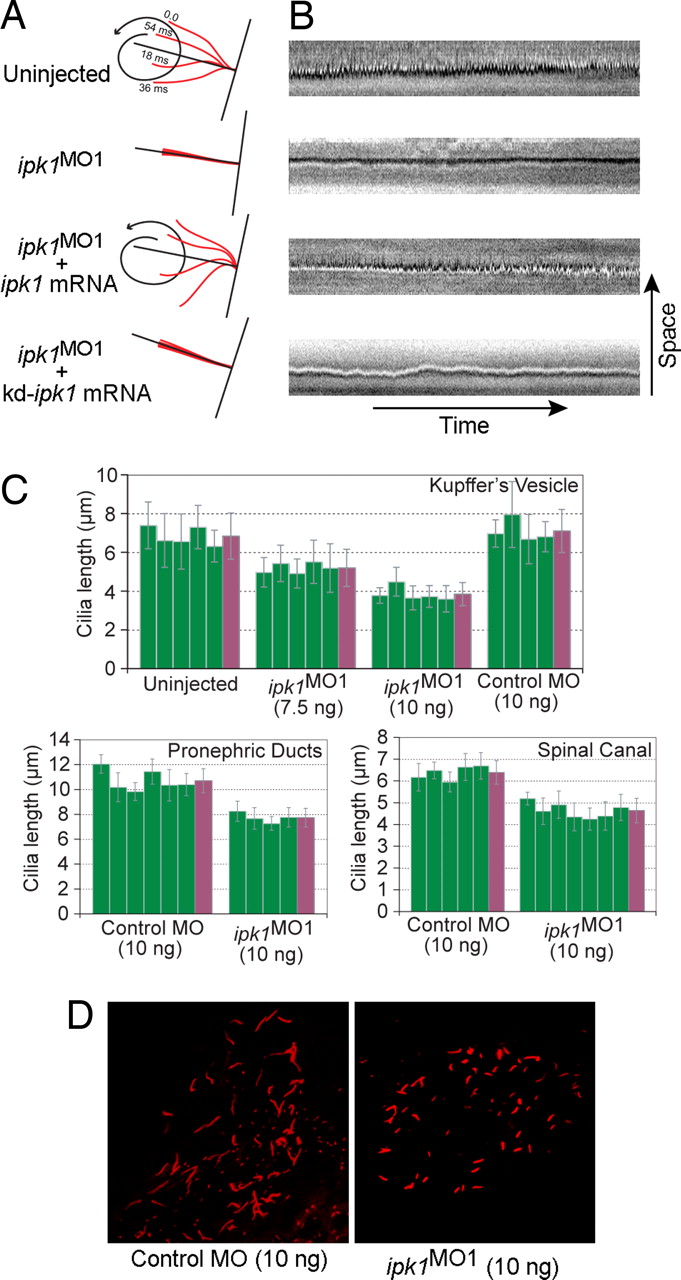
Fig. 1
ipk1 knockdown reduces normal ciliary beating and length. (A and B) Schematic diagrams (A) and kymographs (B) showing trajectory of a cilium in uninjected, ipk1 MO1-injected, ipk1 MO1 plus wild-type ipk1 mRNA-injected, or ipk1 MO1 plus kinase-dead (kd) ipk1 mRNA-injected embryos. (C) Graphs for measurements of ciliary length from individual embryos (green), with the mean ciliary length (far right, purple) determined from multiple independent measurements for KV (n > 26), pronephric duct (n > 13), and spinal canal (n > 14) cilia. (D) Representative images of KV cilia (red) from embryos injected with 10 ng of either control MO or ipk1 MO1. n, number of cilia measured per embryo.